
mbarcala
Active member
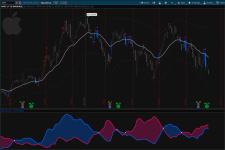
Here its Break Keltner Bands or BKB. This is a nice way to follow your exit or entry point depending your experience. The Keltner band levels can be change to your desires or what ever your feel more appropriate for you.
1 - Blue bars represent when the price crossing up or down the moving average.
2 - Small Burgundy dots, show you the price direction. (if the price crosses above the EMA the dot appear on the bottom of the candle and vice versa. if the price movement stay vertical and price cross multiple time the EMA, the small dots will only show at the last crossing candle, It will try to identify the right direction)
3 - Big Red Dot out the bands represent a possible change direction on that trend.
You can find the lower study here: https://usethinkscript.com/threads/absolute-strength-indicator-asi-for-thinkorswim.10102/
Photo:
14546[/ATTACH]']

script:
1 - Blue bars represent when the price crossing up or down the moving average.
2 - Small Burgundy dots, show you the price direction. (if the price crosses above the EMA the dot appear on the bottom of the candle and vice versa. if the price movement stay vertical and price cross multiple time the EMA, the small dots will only show at the last crossing candle, It will try to identify the right direction)
3 - Big Red Dot out the bands represent a possible change direction on that trend.
You can find the lower study here: https://usethinkscript.com/threads/absolute-strength-indicator-asi-for-thinkorswim.10102/
Photo:
14546[/ATTACH]']
script:
Code:
#Break Keltner bands Signal by mbarcala
# - Blue bars represent when the price crossing up or down the moving average.
# - Small Burgundy dots, show you the price direction. (if the price crosses above the EMA the dot appear on the bottom of the candle and vice versa. if the price movement stay vertical and price cross multiple time the EMA, the small dots will only show at the last crossing candle, It will try to identify the right direction)
# - Big Red Dot out the bands represent a possible change direction on that trend.

input length = 20;
input factor = 2.6;

plot AvgExp = ExpAverage(close, length);
AvgExp.HideTitle();
AvgExp.HideBubble();
AvgExp.SetDefaultColor(Color.GRAY);
AvgExp.SetLineWeight(3);

plot AvgExph = ExpAverage(high, length);
AvgExph.SetStyle(Curve.SHORT_DASH);
AvgExph.SetDefaultColor(CreateColor(122, 0, 102));
AvgExph.HideBubble();
AvgExph.HideTitle();

plot AvgExpl = ExpAverage(low, length);
AvgExpl.SetStyle(Curve.SHORT_DASH);
AvgExpl.SetDefaultColor(CreateColor(122, 0, 102));
AvgExpl.HideBubble();
AvgExpl.HideTitle();

def UpSignal = if close[1] crosses below AvgExp and close crosses above AvgExp or close crosses above AvgExp then 1 else 0;
def DnSignal = if close[1] crosses above AvgExp and close crosses below AvgExp or close crosses below AvgExp then 1 else 0;

AssignPriceColor(if UpSignal or DnSignal then CreateColor(0,101,255) else Color.DARK_GRAY);

def prange = high - low;
def phigh = high + prange * .2;
def plow = low - prange * .2;

def SignUpDn = if UpSignal or DnSignal then 1 else if SignUpDn[1] == 1 and UpSignal or DnSignal then 1 else 0;

def debug = yes;
plot x = if !debug then Double.NAN else SignUpDn;
x.Hide();

## Crossing 20 Point Signal ##
plot SignUpDt = if UpSignal and signUpDn[-1] == 0 then plow else if DnSignal and signUpDn[-1] == 0 then phigh else Double.NaN;
SignUpDt.SetDefaultColor(CreateColor(230,17,125));
SignUpDt.SetStyle(Curve.POINTS);
SignUpDt.SetLineWeight(3);
SignUpDt.HideTitle();
SignUpDt.HideBubble();

#Keltner Bands
def shift = factor * ExpAverage(TrueRange(high, close, low), length);
def average = ExpAverage(close, length);

plot Upper_Band = average + shift;
Upper_Band.SetDefaultColor(CreateColor(50,50,50));
Upper_Band.SetStyle(Curve.LONG_DASH);
Upper_Band.HideBubble();
Upper_Band.HideTitle();

plot Lower_Band = average - shift;
Lower_Band.SetDefaultColor(CreateColor(50,50,50));
Lower_Band.SetStyle(Curve.LONG_DASH);
Lower_Band.HideBubble();
Lower_Band.HideTitle();

#Out KeltnerChannels Bands
plot obHighLow = if close > Upper_Band or open > Upper_Band then phigh else if close < Lower_Band or open < Lower_Band then plow else Double.NaN;
obHighLow.SetStyle(Curve.POINTS);
obHighLow.SetDefaultColor(Color.BLACK);
obHighLow.SetLineWeight(1);
obHighLow.HideTitle();
obHighLow.HideBubble();

plot obHighLowbg = if close > Upper_Band or open > Upper_Band then phigh else if close < Lower_Band or open < Lower_Band then plow else Double.NaN;
obHighLowbg.SetStyle(Curve.POINTS);
obHighLowbg.SetDefaultColor(Color.RED);
obHighLowbg.SetLineWeight(5);
obHighLowbg.HideTitle();
obHighLowbg.HideBubble();
Attachments
Last edited:
