Happymono
New member
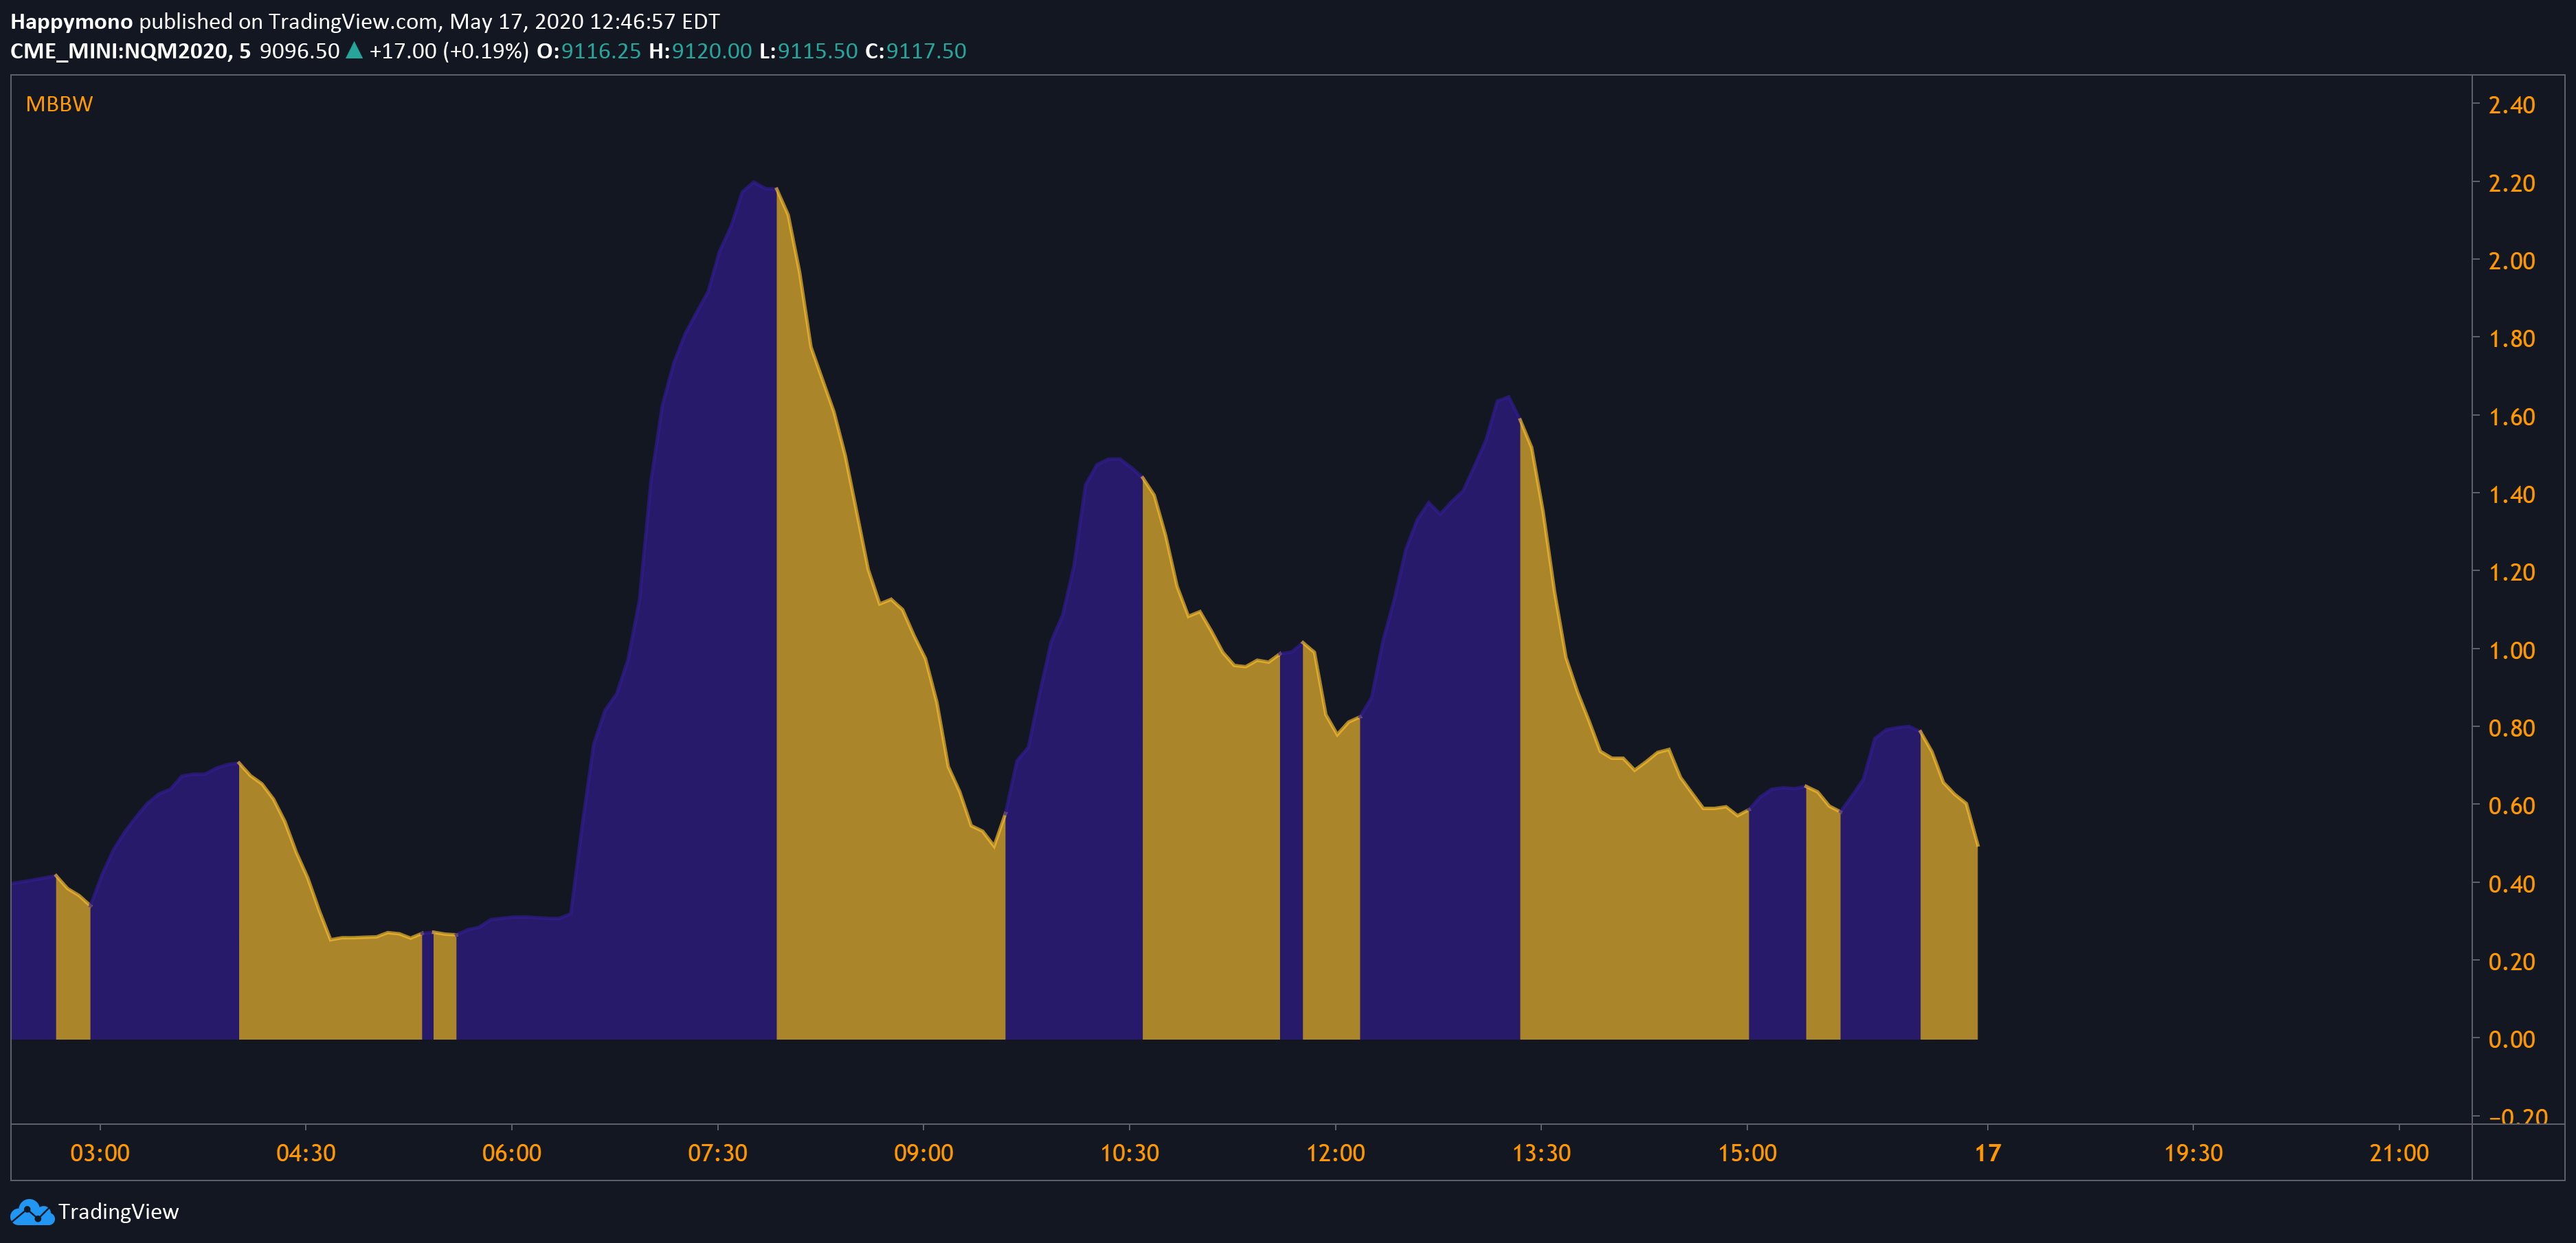
Looked around to see if there were any scripts similar but to no avail the idea being that the color will shift in regards to the bands contracting or expanding
also curious if the color shift could be plotted onto the middle bollinger moving average to lessen the amount of lower indicators

also curious if the color shift could be plotted onto the middle bollinger moving average to lessen the amount of lower indicators
Code:
//@version=3
// Hector R. Madrid : Bollinger Bands Width.  : 6/JUN/2014 22:57 : 2.0
// The contractions and expansions of the bands are
// represented by two different colors.
//

study(title="Madrid Bollinger Bands Width", shorttitle="MBBW")
src = input(close, type=source)
length = input(34, minval=1), mult = input(2.0, minval=0.001, maxval=50)

basis = sma(src, length)
dev = stdev(src, length)
upper1 = basis + dev
lower1 = basis - dev
upper2 = basis + 2*dev
lower2 = basis - 2*dev

bbw = (upper2 - lower2)*100/lower2

// Output
plot(bbw, color=bbw-ema(bbw,5)>=0?teal:navy, linewidth=2, style=area)