Bollinger Band with RSI For ThinkOrSwim

FOTM_8888

Active member
i will like help to create this trading system using Bollinger Band and the RSI.

Indicator:
Bollinger Band Setting 30 with 2 deviation.
Regular RSI.

Criteria:
for Short:
When the price is over the bollinger band top and the RSI is over 70 then assign a RED candles and plot a red arrow.

for LONG:
When the price is under the bollinger band bottom and the RSI is under 30 then assign a Green candles an plot a green arrow.
if is not either criteria keep the candles gray color.

thank you in advance!!!


Code:
#bb_rsi_colors

#https://usethinkscript.com/threads/bollinger-band-with-rsi.17083/
#Bollinger Band with RSI

#Indicator:
#Bollinger Band Setting 30 with 2 deviation.
#Regular RSI.

#Criteria:
#for Short:
#When the price is over the bollinger band top and the RSI is over 70 then assign a RED candles and plot a red arrow.

#for LONG:
#When the price is under the bollinger band bottom and the RSI is under 30 then assign a Green candles an plot a green arrow.
#if is not either criteria keep the candles gray color.

def na = double.nan;
def bn = barnumber();
input price = close;

input color_the_bars = yes;
input show_arrows = yes;

#-----------------------------
# BB
#input price = close;
#input displace = 0;
input bb_length = 30;
input Num_Dev_Dn = -2.0;
input Num_Dev_up = 2.0;
input bb_avg_type = AverageType.SIMPLE;
def sDev = StDev(price, bb_length);

def MidLine = MovingAverage(bb_avg_type, price, bb_length);
def LowerBand = MidLine + Num_Dev_Dn * sDev;
def UpperBand = MidLine + Num_Dev_up * sDev;

input show_bb_lines = yes;
plot zbbup = if show_bb_lines then upperband else na;
plot zbbmid = if show_bb_lines then midline else na;
plot zbblo = if show_bb_lines then lowerband else na;
zbbup.SetDefaultColor(GetColor(5));
zbbmid.SetDefaultColor(GetColor(1));
zbblo.SetDefaultColor(GetColor(0));

#-------------------------------
# rsi
input rsi_len = 14;
input rsi_over_bought = 70;
input rsi_over_Sold = 30;
input rsi_avg_type = AverageType.WILDERS;
def NetChgAvg = MovingAverage(rsi_avg_type, price - price[1], rsi_len);
def TotChgAvg = MovingAverage(rsi_avg_type, AbsValue(price - price[1]), rsi_len);
def ChgRatio = if TotChgAvg != 0 then NetChgAvg / TotChgAvg else 0;
def RSI = 50 * (ChgRatio + 1);

#------------------------------

def long_rule1 = (close < lowerband);
def long_rule2 = (rsi < rsi_over_Sold);

def short_rule1 = (close > upperband);
def short_rule2 = (rsi > rsi_over_bought);

def long = long_rule1 and long_rule2;
def short = short_rule1 and short_rule2;

#------------------------------

def y = 0.002;
plot zlong = if show_arrows and long then (low * (1 - y)) else na;
zlong.SetPaintingStrategy(PaintingStrategy.ARROW_UP);
zlong.SetDefaultColor(Color.green);
zlong.setlineweight(1);
zlong.hidebubble();

plot zshort = if show_arrows and short then (high * (1 + y)) else na;
zshort.SetPaintingStrategy(PaintingStrategy.ARROW_DOWN);
zshort.SetDefaultColor(Color.red);
zshort.setlineweight(1);
zshort.hidebubble();

#------------------------------

AssignPriceColor(if !color_the_bars then color.current
 else if long then color.green
 else if short then color.red
 else color.gray);
#

INTC 15min
rsi shown for reference
FCiqUbT.jpg
 

Join useThinkScript to post your question to a community of 21,000+ developers and traders.

Code:
#bb_rsi_colors

#https://usethinkscript.com/threads/bollinger-band-with-rsi.17083/
#Bollinger Band with RSI

#Indicator:
#Bollinger Band Setting 30 with 2 deviation.
#Regular RSI.

#Criteria:
#for Short:
#When the price is over the bollinger band top and the RSI is over 70 then assign a RED candles and plot a red arrow.

#for LONG:
#When the price is under the bollinger band bottom and the RSI is under 30 then assign a Green candles an plot a green arrow.
#if is not either criteria keep the candles gray color.

def na = double.nan;
def bn = barnumber();
input price = close;

input color_the_bars = yes;
input show_arrows = yes;

#-----------------------------
# BB
#input price = close;
#input displace = 0;
input bb_length = 30;
input Num_Dev_Dn = -2.0;
input Num_Dev_up = 2.0;
input bb_avg_type = AverageType.SIMPLE;
def sDev = StDev(price, bb_length);

def MidLine = MovingAverage(bb_avg_type, price, bb_length);
def LowerBand = MidLine + Num_Dev_Dn * sDev;
def UpperBand = MidLine + Num_Dev_up * sDev;

input show_bb_lines = yes;
plot zbbup = if show_bb_lines then upperband else na;
plot zbbmid = if show_bb_lines then midline else na;
plot zbblo = if show_bb_lines then lowerband else na;
zbbup.SetDefaultColor(GetColor(5));
zbbmid.SetDefaultColor(GetColor(1));
zbblo.SetDefaultColor(GetColor(0));

#-------------------------------
# rsi
input rsi_len = 14;
input rsi_over_bought = 70;
input rsi_over_Sold = 30;
input rsi_avg_type = AverageType.WILDERS;
def NetChgAvg = MovingAverage(rsi_avg_type, price - price[1], rsi_len);
def TotChgAvg = MovingAverage(rsi_avg_type, AbsValue(price - price[1]), rsi_len);
def ChgRatio = if TotChgAvg != 0 then NetChgAvg / TotChgAvg else 0;
def RSI = 50 * (ChgRatio + 1);

#------------------------------

def long_rule1 = (close < lowerband);
def long_rule2 = (rsi < rsi_over_Sold);

def short_rule1 = (close > upperband);
def short_rule2 = (rsi > rsi_over_bought);

def long = long_rule1 and long_rule2;
def short = short_rule1 and short_rule2;

#------------------------------

def y = 0.002;
plot zlong = if show_arrows and long then (low * (1 - y)) else na;
zlong.SetPaintingStrategy(PaintingStrategy.ARROW_UP);
zlong.SetDefaultColor(Color.green);
zlong.setlineweight(1);
zlong.hidebubble();

plot zshort = if show_arrows and short then (high * (1 + y)) else na;
zshort.SetPaintingStrategy(PaintingStrategy.ARROW_DOWN);
zshort.SetDefaultColor(Color.red);
zshort.setlineweight(1);
zshort.hidebubble();

#------------------------------

AssignPriceColor(if !color_the_bars then color.current
 else if long then color.green
 else if short then color.red
 else color.gray);
#

INTC 15min
rsi shown for reference
FCiqUbT.jpg
@halcyonguy ! great job! thank you very much
 
very nice looking, so much so that i took the liberty of changing the code to use keltner bands instead of BBs. hope you don't mind but i like the former more than the latter. if you see any errors, please to let me know.

Code:
#k_rsi_colors

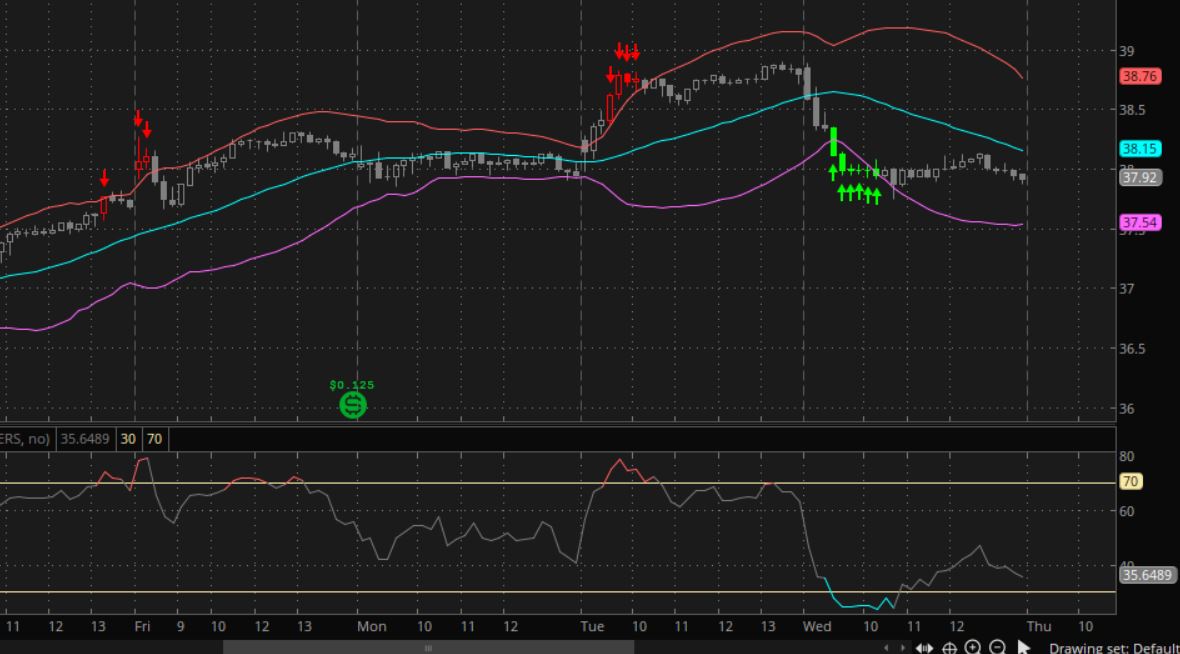
#Keltner Band with RSI

#based on Bollinger Band with RSI coded by Halcyonguy, so all credit goes to Halcyonguy

#https://usethinkscript.com/threads/bollinger-band-with-rsi.17083/

##########################

def na = double.nan;
def bn = barnumber();
input price = close;

input color_the_bars = yes;
input show_arrows = yes;

#------------------------------
#keltner

input factor2  = 2.00;
input length   =  20;
input trlength = 10;

input Avgtype_ma  = AverageType.EXPONENTIAL;
input Avgtype_tr  = AverageType.WILDERS;

def tr = MovingAverage(Avgtype_tr, TrueRange(high, close, low), trlength);

def Average = MovingAverage(Avgtype_ma, price, length);
def Upper_Band2 = Average + tr * factor2;
def Lower_Band2 = Average - tr * factor2;

input show_kelt_lines = yes;
plot zkup = if show_kelt_lines then upper_band2 else na;
plot zkmid = if show_kelt_lines then average else na;
plot zklo = if show_kelt_lines then lower_band2 else na;
zkup.SetDefaultColor(GetColor(5));
zkmid.SetDefaultColor(GetColor(1));
zklo.SetDefaultColor(GetColor(0));

#-------------------------------
# rsi
input rsi_len = 14;
input rsi_over_bought = 70;
input rsi_over_Sold = 30;
input rsi_avg_type = AverageType.WILDERS;
def NetChgAvg = MovingAverage(rsi_avg_type, price - price[1], rsi_len);
def TotChgAvg = MovingAverage(rsi_avg_type, AbsValue(price - price[1]), rsi_len);
def ChgRatio = if TotChgAvg != 0 then NetChgAvg / TotChgAvg else 0;
def RSI = 50 * (ChgRatio + 1);

#------------------------------

def long_rule1 = (close < lower_band2);
def long_rule2 = (rsi < rsi_over_Sold);

def short_rule1 = (close > upper_band2);
def short_rule2 = (rsi > rsi_over_bought);

def long = long_rule1 and long_rule2;
def short = short_rule1 and short_rule2;

#------------------------------

def y = 0.002;
plot zlong = if show_arrows and long then (low * (1 - y)) else na;
zlong.SetPaintingStrategy(PaintingStrategy.ARROW_UP);
zlong.SetDefaultColor(Color.green);
zlong.setlineweight(1);
zlong.hidebubble();

plot zshort = if show_arrows and short then (high * (1 + y)) else na;
zshort.SetPaintingStrategy(PaintingStrategy.ARROW_DOWN);
zshort.SetDefaultColor(Color.red);
zshort.setlineweight(1);
zshort.hidebubble();

#------------------------------

AssignPriceColor(if !color_the_bars then color.current
 else if long then color.green
 else if short then color.red
 else color.gray);
#

here's how it looks with SPXL on a daily chart:
QLvAWvo[1].png
 

Similar threads

Not the exact question you're looking for?

Start a new thread and receive assistance from our community.

87k+ Posts
393 Online
Create Post

Similar threads

Similar threads

The Market Trading Game Changer

Join 2,500+ subscribers inside the useThinkScript VIP Membership Club
  • Exclusive indicators
  • Proven strategies & setups
  • Private Discord community
  • ‘Buy The Dip’ signal alerts
  • Exclusive members-only content
  • Add-ons and resources
  • 1 full year of unlimited support

Frequently Asked Questions

What is useThinkScript?

useThinkScript is the #1 community of stock market investors using indicators and other tools to power their trading strategies. Traders of all skill levels use our forums to learn about scripting and indicators, help each other, and discover new ways to gain an edge in the markets.

How do I get started?

We get it. Our forum can be intimidating, if not overwhelming. With thousands of topics, tens of thousands of posts, our community has created an incredibly deep knowledge base for stock traders. No one can ever exhaust every resource provided on our site.

If you are new, or just looking for guidance, here are some helpful links to get you started.

What are the benefits of VIP Membership?
VIP members get exclusive access to these proven and tested premium indicators: Buy the Dip, Advanced Market Moves 2.0, Take Profit, and Volatility Trading Range. In addition, VIP members get access to over 50 VIP-only custom indicators, add-ons, and strategies, private VIP-only forums, private Discord channel to discuss trades and strategies in real-time, customer support, trade alerts, and much more. Learn all about VIP membership here.
How can I access the premium indicators?
To access the premium indicators, which are plug and play ready, sign up for VIP membership here.
Back
Top