I am looking for a bollinger band column for my watch lists.
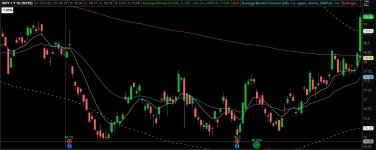
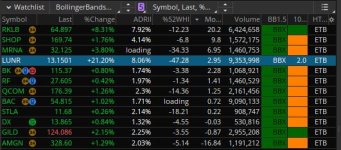
The column would turn green for any stock that crosses above and stays above the upper bollinger band with a length of 200 and a std deviation of 1.5 based on 1 Day time-frame. If doesn't meet that criteria column would be orange.
If the stock crosses below and stays below the lower bollinger band that has a length of 200 and a std deviation of -1.5 based on 1 Day time-frame the column would be red or dark red. If doesn't meet that criteria column would be orange.
I attempted to use the TOS BollingerBands under columns and it just spit out numbers that didn't seem to coincide with anything on the charts... all the "setups" appeared quite random from one to the next.
Thank You