Can anyone assist me in getting the arrows to show in the Thinkscript code below? I am not very experienced with Thinkscript coding, watched a bunch of videos but as you can see from my elementary attempt I am pretty much useless. ") Any help you can provide would be greatly appreciated.
Any help you can provide would be greatly appreciated.
declare upper;
input short_average = 8;
input medium_average = 14;
input long_average = 28;
input average_type = {default "SMA", "EMA"};
input showArrows = yes;
def MA1;
def MA2;
switch (average_type) {
case "SMA":
MA1 = Average(close, short_average);
MA2 = Average(close, medium_average);
case "EMA":
MA1 = ExpAverage(close, short_average);
MA2 = ExpAverage(close, medium_average);
}
# Plot the moving average lines
plot ln1 = MA1;
ln1.SetDefaultColor(color.blue);
ln1.SetStyle(Curve.LONG_DASH);
ln1.SetLineWeight(2);
plot ln2 = MA2;
ln2.SetDefaultColor(color.yellow);
ln2.SetStyle(Curve.LONG_DASH);
# Calculate Meter Values
def sl1 = ma1 > ma1[1];
def sl2 = ma2 > ma2[1];
def p1 = close > ma1;
def p2 = close > ma2;
def u1 = 2 * (close > open);
def u2 = 2 * (close > high[1]);
def d1 = 2 * (close < open);
def d2 = 2 * (close < low[1]);
def UPstr = sl1 + sl2 + p1 + p2 + u1 + u2;
def DNstr = !sl1 + !sl2 + !p1 +!p2 + d1 + d2;
Any help you can provide would be greatly appreciated.declare upper;
input short_average = 8;
input medium_average = 14;
input long_average = 28;
input average_type = {default "SMA", "EMA"};
input showArrows = yes;
def MA1;
def MA2;
switch (average_type) {
case "SMA":
MA1 = Average(close, short_average);
MA2 = Average(close, medium_average);
case "EMA":
MA1 = ExpAverage(close, short_average);
MA2 = ExpAverage(close, medium_average);
}
# Plot the moving average lines
plot ln1 = MA1;
ln1.SetDefaultColor(color.blue);
ln1.SetStyle(Curve.LONG_DASH);
ln1.SetLineWeight(2);
plot ln2 = MA2;
ln2.SetDefaultColor(color.yellow);
ln2.SetStyle(Curve.LONG_DASH);
# Calculate Meter Values
def sl1 = ma1 > ma1[1];
def sl2 = ma2 > ma2[1];
def p1 = close > ma1;
def p2 = close > ma2;
def u1 = 2 * (close > open);
def u2 = 2 * (close > high[1]);
def d1 = 2 * (close < open);
def d2 = 2 * (close < low[1]);
def UPstr = sl1 + sl2 + p1 + p2 + u1 + u2;
def DNstr = !sl1 + !sl2 + !p1 +!p2 + d1 + d2;
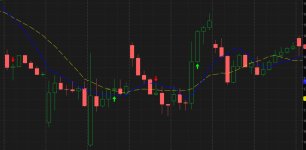

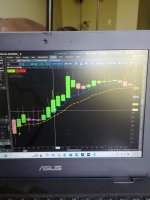
 How do we separate out the functionality in JPG#1 from JPG#2 if we want to keep the chart cleaner?