Anyone like to try and code this?
See Picture for better visual idea of how it would work / look like.
This indicator strategy would find when one arc ends and a new one begins. Entry on a new arc for very safe entry.
(I jokingly call it the "pot of gold" at the end of the rainbow, because it's such a low risk entry.)


See Picture for better visual idea of how it would work / look like.
This indicator strategy would find when one arc ends and a new one begins. Entry on a new arc for very safe entry.
(I jokingly call it the "pot of gold" at the end of the rainbow, because it's such a low risk entry.)
- Things to know about arcs before I explain the indicator function:
- Quadratic Arc behavior:
- Markets move in waves, contained within Quadratic Arc curves. Arcs can be symmetrical, from a middle point called the point of inflection. So, front half mirror the back half.
- If given only the front side data, with assumption of the most current point being the current point of inflection, you can assume the back side of the curve as a predictor.
- Quadratic Arc behavior:
- Ideas on how to write an arc using math: https://www.quora.com/How-do-I-find-the-maximum-minimum-and-point-of-inflection-of-the-function-f-x-2x²-6x+5
- Progression of arc as a sequence of conditional events:
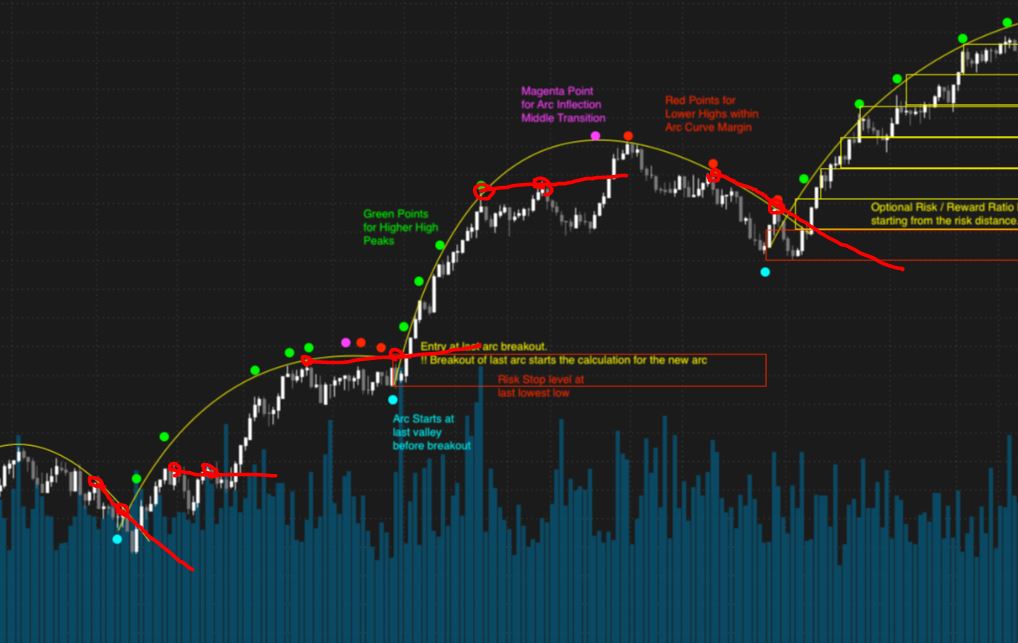
- Arc would start on a breakout candle. Entry Here, with risk down to last lowest low
- Arc curve is drawn from last valley low before the breakout. use the quadratic arc formula to draw the arc using at least 3 points. Would be helpful to project the curve into the future, as a predictor if you know how to code that.
- YES, the arc WILL repaint by adding in new high peaks. These are shown as green points.
- The most current peak would be considered the magenta inflection point until there are no more high peaks... This is the current middle high of the arc shape
- which then display as red point indicator conditions. (time to get out of the uptrend arc.)
- Arc ends when new arc breakout begins.
- Problems I see will come up when trying to explain this in computer code:
- How to filter only the bigger highs, and not the smaller. This could turn into a fractal problem, and you would see arcs within arcs. We only want the larger arc shape. Later we could add a feature to select the arc size or detail, but I'm just trying to narrow down to the minimum viable product right now.
Last edited by a moderator: