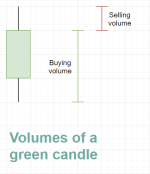
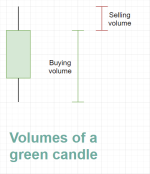
All Buy / Sell Volume Pressure Indicators & Labels For ThinkOrSwim

BUY SELL VOLUME WITH AVERAGES AND PERCENTAGES


Code:
################################
# Original script by Cwparker23#
################################

# Original script by Cwparker23                    #
#-----------------
#DISCLAIMER
#-----------------
#I am not a certified financial advisor. The content of this page/site and tools are for informational purposes only and does not constitute financial or legal advice. Under no circumstances will the author be responsible for errors or use of this tool and site. User assumes all risks.

declare lower;
declare zerobase;

def O = open;
def H = high;
def C = close;
def L = low;
def V = volume;
DEF VOLAVG= expaverage (V);
#############################################
def buying = ((C - L) / (H - L))*volume;
def selling = ((H - C) / (H - L)*volume);
DEF buying_AVG= expaverage (buying);
DEF selling_AVG= expaverage (selling);
AddLabel(yes, "BAR: " + volume, Color.WHITE);

def buy_percentage = (buying_AVG/VOLAVG)*100;
AddLabel (yes, "BUY_VOL " + Round (buying , 2) + "    BUY_AVG " + round (buying_AVG)+  "   %" + round (buy_percentage) + "", (if buying_AVG > selling_AVG then Color.GREEN else if buying_AVG < selling_AVG then Color.GRAY else Color.YELLOW));

def SELL_percentage = (selling_AVG/VOLAVG)*100;
AddLabel (yes, "SELL_VOL " + Round (selling , 2) + "    SELL_AVG " + round (selling_AVG)+  "   %" + round (SELL_percentage) + "", (if buying_AVG < selling_AVG then Color.RED else if buying_AVG > selling_AVG then Color.GRAY  else Color.YELLOW));
 

Join useThinkScript to post your question to a community of 21,000+ developers and traders.

Dear all,

Appreciate if anyone can help me to convert to TOS with the following script which was written for TradingView. Thank you very much!
https://www.tradingview.com/script/oG3G1T09/
VBSM.jpg
 
Last edited by a moderator:
I think this does it...

#Volume Based Buy and Sell Momentum by 2tm
#Converted to thinkscript

declare lower;

input EMA_length = 25;

def xROC = ((close / close[1]) - 1) * 100;
def Vdn = volume < volume[1];
def Vup = volume > volume[1];
def xROC_Vdn = if Vdn then xROC else 0;
def xROC_Vup = if Vup then xROC else 0;

def nRes1 = totalsum(xROC_Vdn);
def nRes2 = totalsum(XROC_Vup);
def nRes3 = nRes1 + nRes2;

def nResEMA3 = SimpleMovingAvg(nRes1, EMA_length) + SimpleMovingAvg(nRes2, EMA_length);

plot PNVI = nRes3;
PNVI.SetDefaultColor(Color.BLUE);
plot PEMA = nResEMA3;
PEMA.SetDefaultColor(Color.RED);
AddCloud(PNVI, PEMA, CreateColor(0, 40,148), CreateColor(255,63,59));

AssignBackgroundColor(Color.WHITE);
 
It work perfectly.
Thank you very much!
the use of double averages is redundant

def nResEMA3 = SimpleMovingAvg(nRes1, EMA_length) + SimpleMovingAvg(nRes2, EMA_length);

would be the same as

def nResEMA3 = SimpleMovingAvg(nRes1 + nRes2, EMA_length) ;
 
here is a multi length version that uses a 2 pole butterworth filter "Base vs Averages"
Code:
declare lower;

input Period1 = 3;
input Period2 = 5;
input Period3 = 8;
input Period4 = 10;
input Period5 = 12;
input Period6 = 15;
input Period7 = 30;
input Period8 = 35;
input Period9 = 40;
input Period10 = 45;
input Period11 = 50;
input Period12 = 60;
input Dotsize = 3;
input Paintbars =0;
def xROC = ((close / close[1]) - 1) * 100;
def Vdn = volume < volume[1];
def Vup = volume > volume[1];
def xROC_Vdn = if Vdn then xROC else 0;
def xROC_Vup = if Vup then xROC else 0;

def nRes1 = totalsum(xROC_Vdn);
def nRes2 = totalsum(XROC_Vup);
def nRes3 = nRes1 + nRes2;
Def price = nRes3;
def a1A = exp(-1.414 * 3.14159 / Period1);
def b1A = 2 * a1A * Cos(1.414 * 3.14159 / Period1);
def coef2A =b1A;
def coef3A = -a1A * a1A;
def coef1A = (1 – b1A + a1A * a1A) / 4;
rec ButterA = if barNumber() < 3 then Price else coef1A * (Price + 2 * Price[1] + Price[2]) + coef2A * ButterA[1] + coef3A * ButterA[2];
def a1B = exp(-1.414 * 3.14159 / Period2);
def b1B = 2 * a1B * Cos(1.414 * 3.14159 / Period2);
def coef2B =b1B;
def coef3B = -a1B * a1B;
def coef1B = (1 – b1B + a1B * a1B) / 4;
rec ButterB = if barNumber() < 3 then Price else coef1B * (Price + 2 * Price[1] + Price[2]) + coef2B * ButterB[1] + coef3B * ButterB[2];
def a1C = exp(-1.414 * 3.14159 / Period3);
def b1C = 2 * a1C * Cos(1.414 * 3.14159 / Period3);
def coef2C =b1C;
def coef3C = -a1C * a1C;
def coef1C = (1 – b1C + a1C * a1C) / 4;
rec ButterC = if barNumber() < 3 then Price else coef1C * (Price + 2 * Price[1] + Price[2]) + coef2C * ButterC[1] + coef3C * ButterC[2];
def a1D = exp(-1.414 * 3.14159 / Period4);
def b1D = 2 * a1D * Cos(1.414 * 3.14159 / Period4);
def coef2D =b1D;
def coef3D = -a1D * a1D;
def coef1D = (1 – b1D + a1D * a1D) / 4;
rec ButterD= if barNumber() < 3 then Price else coef1D * (Price + 2 * Price[1] + Price[2]) + coef2D * ButterD[1] + coef3D * ButterD[2];
def a1E = exp(-1.414 * 3.14159 / Period5);
def b1E = 2 * a1E * Cos(1.414 * 3.14159 / Period5);
def coef2E =b1E;
def coef3E = -a1E * a1E;
def coef1E = (1 – b1E + a1E * a1E) / 4;
rec ButterE = if barNumber() < 3 then Price else coef1E * (Price + 2 * Price[1] + Price[2]) + coef2E * ButterE[1] + coef3E * ButterE[2];
def a1F = exp(-1.414 * 3.14159 / Period6);
def b1F = 2 * a1F * Cos(1.414 * 3.14159 / Period6);
def coef2F =b1F;
def coef3F = -a1F * a1F;
def coef1F = (1 – b1F + a1F * a1F) / 4;
rec ButterF = if barNumber() < 3 then Price else coef1F * (Price + 2 * Price[1] + Price[2]) + coef2F * ButterF[1] + coef3F * ButterF[2];
def a1G = exp(-1.414 * 3.14159 / Period7);
def b1G = 2 * a1G * Cos(1.414 * 3.14159 / Period7);
def coef2G =b1G;
def coef3G = -a1G * a1G;
def coef1G = (1 – b1G + a1G * a1G) / 4;
rec ButterG = if barNumber() < 3 then Price else coef1G * (Price + 2 * Price[1] + Price[2]) + coef2G * ButterG[1] + coef3G * ButterG[2];
def a1H = exp(-1.414 * 3.14159 / Period8);
def b1H = 2 * a1H * Cos(1.414 * 3.14159 / Period8);
def coef2H =b1H;
def coef3H = -a1H * a1H;
def coef1H = (1 – b1H + a1H * a1H) / 4;
rec ButterH = if barNumber() < 3 then Price else coef1H * (Price + 2 * Price[1] + Price[2]) + coef2H * ButterH[1] + coef3H * ButterH[2];
def a1I = exp(-1.414 * 3.14159 / Period9);
def b1I = 2 * a1I * Cos(1.414 * 3.14159 / Period9);
def coef2I =b1I;
def coef3I = -a1I * a1I;
def coef1I = (1 – b1I + a1I * a1I) / 4;
rec ButterI = if barNumber() < 3 then Price else coef1I * (Price + 2 * Price[1] + Price[2]) + coef2I * ButterI[1] + coef3I * ButterI[2];
def a1J = exp(-1.414 * 3.14159 / Period10);
def b1J = 2 * a1J * Cos(1.414 * 3.14159 / Period10);
def coef2J =b1J;
def coef3J = -a1J * a1J;
def coef1J = (1 – b1J + a1J * a1J) / 4;
rec ButterJ = if barNumber() < 3 then Price else coef1J * (Price + 2 * Price[1] + Price[2]) + coef2J * ButterJ[1] + coef3J * ButterJ[2];
def a1K = exp(-1.414 * 3.14159 / Period11);
def b1K = 2 * a1K * Cos(1.414 * 3.14159 / Period11);
def coef2K =b1K;
def coef3K = -a1K * a1K;
def coef1K = (1 – b1K + a1K * a1K) / 4;
rec ButterK = if barNumber() < 3 then Price else coef1K * (Price + 2 * Price[1] + Price[2]) + coef2K * ButterK[1] + coef3K * ButterK[2];
def a1L = exp(-1.414 * 3.14159 / Period12);
def b1L = 2 * a1L * Cos(1.414 * 3.14159 / Period12);
def coef2L =b1L;
def coef3L = -a1L * a1L;
def coef1L = (1 – b1L + a1L * a1L) / 4;
rec ButterL = if barNumber() < 3 then Price else coef1L * (Price + 2 * Price[1] + Price[2]) + coef2L * ButterL[1] + coef3L * ButterL[2];
plot A1_Dot = if IsNaN(Close) then Double.NaN else 1;
A1_Dot.SetPaintingStrategy(PaintingStrategy.TRIANGLES);
A1_Dot.SetLineWeight(DotSize);
A1_Dot.AssignValueColor(if ButterA <= nRes3 then Color.Cyan else Color.Magenta);
plot A2_Dot = if IsNaN(Close) then Double.NaN else 2;
A2_Dot.SetPaintingStrategy(PaintingStrategy.TRIANGLES);
A2_Dot.SetLineWeight(DotSize);
A2_Dot.AssignValueColor(if ButterB <= nRes3 then Color.Cyan else Color.Magenta);
plot A3_Dot = if IsNaN(Close) then Double.NaN else 3;
A3_Dot.SetPaintingStrategy(PaintingStrategy.TRIANGLES);
A3_Dot.SetLineWeight(DotSize);
A3_Dot.AssignValueColor(if ButterC <= nRes3 then Color.Cyan else Color.Magenta);
plot A4_Dot = if IsNaN(Close) then Double.NaN else 4;
A4_Dot.SetPaintingStrategy(PaintingStrategy.TRIANGLES);
A4_Dot.SetLineWeight(DotSize);
A4_Dot.AssignValueColor(if ButterD <= nRes3 then Color.Cyan else Color.Magenta);
plot A5_Dot = if IsNaN(Close) then Double.NaN else 5;
A5_Dot.SetPaintingStrategy(PaintingStrategy.TRIANGLES);
A5_Dot.SetLineWeight(DotSize);
A5_Dot.AssignValueColor(if ButterE <= nRes3 then Color.Cyan else Color.Magenta);
plot A6_Dot = if IsNaN(Close) then Double.NaN else 6;
A6_Dot.SetPaintingStrategy(PaintingStrategy.TRIANGLES);
A6_Dot.SetLineWeight(DotSize);
A6_Dot.AssignValueColor(if ButterF <= nRes3 then Color.Cyan else Color.Magenta);
plot B7_Dot = if IsNaN(Close) then Double.NaN else 7;
B7_Dot.SetPaintingStrategy(PaintingStrategy.TRIANGLES);
B7_Dot.SetLineWeight(DotSize);
B7_Dot.AssignValueColor(if ButterG <= nRes3 then Color.Blue else Color.Red);
plot B8_Dot = if IsNaN(Close) then Double.NaN else 8;
B8_Dot.SetPaintingStrategy(PaintingStrategy.TRIANGLES);
B8_Dot.SetLineWeight(DotSize);
B8_Dot.AssignValueColor(if ButterH <= nRes3 then Color.Blue else Color.Red);
plot B9_Dot = if IsNaN(Close) then Double.NaN else 9;
B9_Dot.SetPaintingStrategy(PaintingStrategy.TRIANGLES);
B9_Dot.SetLineWeight(DotSize);
B9_Dot.AssignValueColor(if ButterI <= nRes3 then Color.Blue else Color.Red);
plot B10_Dot = if IsNaN(Close) then Double.NaN else 10;
B10_Dot.SetPaintingStrategy(PaintingStrategy.TRIANGLES);
B10_Dot.SetLineWeight(DotSize);
B10_Dot.AssignValueColor(if ButterJ <= nRes3 then Color.Blue else Color.Red);
plot B11_Dot = if IsNaN(Close) then Double.NaN else 11;
B11_Dot.SetPaintingStrategy(PaintingStrategy.TRIANGLES);
B11_Dot.SetLineWeight(DotSize);
B11_Dot.AssignValueColor(if ButterK <= nRes3 then Color.Blue else Color.Red);
plot B12_Dot = if IsNaN(Close) then Double.NaN else 12;
B12_Dot.SetPaintingStrategy(PaintingStrategy.TRIANGLES);
B12_Dot.SetLineWeight(DotSize);
B12_Dot.AssignValueColor(if ButterL <= nRes3 then Color.Blue else Color.Red);
AssignPriceColor(if paintbars == 1 and ButterA < nRes3 then Color.Cyan else if paintbars == 1 and ButterA > nRes3 then Color.Magenta else if paintbars == 2 and ButterB < nRes3 then Color.Cyan else if paintbars == 2 and ButterB > nRes3 then Color.Magenta else if paintbars == 3 and ButterC < nRes3 then Color.Cyan else if paintbars == 3 and ButterC > nRes3 then Color.Magenta else if paintbars == 4 and ButterD < nRes3 then Color.Cyan else if paintbars == 4 and ButterD > nRes3 then Color.Magenta else
if paintbars == 5 and ButterE < nRes3 then Color.Cyan else if paintbars == 5 and ButterE > nRes3 then Color.Magenta else if paintbars == 6 and ButterF < nRes3 then Color.Cyan else if paintbars == 6 and ButterF > nRes3 then Color.Magenta else if paintbars == 7 and ButterG < nRes3 then Color.Blue else if paintbars == 7 and ButterG > nRes3 then Color.Red else if paintbars == 8 and ButterH < nRes3 then Color.Blue else if paintbars == 8 and ButterH > nRes3 then Color.Red else
if paintbars == 9 and ButterI < nRes3 then Color.Blue else if paintbars == 9 and ButterI > nRes3 then Color.Red else if paintbars == 10 and ButterJ < nRes3 then Color.Blue else if paintbars == 10 and ButterJ > nRes3 then Color.Red else if paintbars == 11 and ButterK < nRes3 then Color.Blue else if paintbars == 11 and ButterK > nRes3 then Color.Red else if paintbars == 12 and ButterL < nRes3 then Color.Blue else if paintbars == 12 and ButterL > nRes3 then Color.Red else color.Current);


This version is "Averages vs averages 1 bar ago"
Code:
declare lower;

input Period1 = 3;
input Period2 = 5;
input Period3 = 8;
input Period4 = 10;
input Period5 = 12;
input Period6 = 15;
input Period7 = 30;
input Period8 = 35;
input Period9 = 40;
input Period10 = 45;
input Period11 = 50;
input Period12 = 60;
input Dotsize = 3;
Input Paintbars = 0;
def xROC = ((close / close[1]) - 1) * 100;
def Vdn = volume < volume[1];
def Vup = volume > volume[1];
def xROC_Vdn = if Vdn then xROC else 0;
def xROC_Vup = if Vup then xROC else 0;

def nRes1 = totalsum(xROC_Vdn);
def nRes2 = totalsum(XROC_Vup);
def nRes3 = nRes1 + nRes2;
Def price = nRes3;
def a1A = exp(-1.414 * 3.14159 / Period1);
def b1A = 2 * a1A * Cos(1.414 * 3.14159 / Period1);
def coef2A =b1A;
def coef3A = -a1A * a1A;
def coef1A = (1 – b1A + a1A * a1A) / 4;
rec ButterA = if barNumber() < 3 then Price else coef1A * (Price + 2 * Price[1] + Price[2]) + coef2A * ButterA[1] + coef3A * ButterA[2];
def a1B = exp(-1.414 * 3.14159 / Period2);
def b1B = 2 * a1B * Cos(1.414 * 3.14159 / Period2);
def coef2B =b1B;
def coef3B = -a1B * a1B;
def coef1B = (1 – b1B + a1B * a1B) / 4;
rec ButterB = if barNumber() < 3 then Price else coef1B * (Price + 2 * Price[1] + Price[2]) + coef2B * ButterB[1] + coef3B * ButterB[2];
def a1C = exp(-1.414 * 3.14159 / Period3);
def b1C = 2 * a1C * Cos(1.414 * 3.14159 / Period3);
def coef2C =b1C;
def coef3C = -a1C * a1C;
def coef1C = (1 – b1C + a1C * a1C) / 4;
rec ButterC = if barNumber() < 3 then Price else coef1C * (Price + 2 * Price[1] + Price[2]) + coef2C * ButterC[1] + coef3C * ButterC[2];
def a1D = exp(-1.414 * 3.14159 / Period4);
def b1D = 2 * a1D * Cos(1.414 * 3.14159 / Period4);
def coef2D =b1D;
def coef3D = -a1D * a1D;
def coef1D = (1 – b1D + a1D * a1D) / 4;
rec ButterD= if barNumber() < 3 then Price else coef1D * (Price + 2 * Price[1] + Price[2]) + coef2D * ButterD[1] + coef3D * ButterD[2];
def a1E = exp(-1.414 * 3.14159 / Period5);
def b1E = 2 * a1E * Cos(1.414 * 3.14159 / Period5);
def coef2E =b1E;
def coef3E = -a1E * a1E;
def coef1E = (1 – b1E + a1E * a1E) / 4;
rec ButterE = if barNumber() < 3 then Price else coef1E * (Price + 2 * Price[1] + Price[2]) + coef2E * ButterE[1] + coef3E * ButterE[2];
def a1F = exp(-1.414 * 3.14159 / Period6);
def b1F = 2 * a1F * Cos(1.414 * 3.14159 / Period6);
def coef2F =b1F;
def coef3F = -a1F * a1F;
def coef1F = (1 – b1F + a1F * a1F) / 4;
rec ButterF = if barNumber() < 3 then Price else coef1F * (Price + 2 * Price[1] + Price[2]) + coef2F * ButterF[1] + coef3F * ButterF[2];
def a1G = exp(-1.414 * 3.14159 / Period7);
def b1G = 2 * a1G * Cos(1.414 * 3.14159 / Period7);
def coef2G =b1G;
def coef3G = -a1G * a1G;
def coef1G = (1 – b1G + a1G * a1G) / 4;
rec ButterG = if barNumber() < 3 then Price else coef1G * (Price + 2 * Price[1] + Price[2]) + coef2G * ButterG[1] + coef3G * ButterG[2];
def a1H = exp(-1.414 * 3.14159 / Period8);
def b1H = 2 * a1H * Cos(1.414 * 3.14159 / Period8);
def coef2H =b1H;
def coef3H = -a1H * a1H;
def coef1H = (1 – b1H + a1H * a1H) / 4;
rec ButterH = if barNumber() < 3 then Price else coef1H * (Price + 2 * Price[1] + Price[2]) + coef2H * ButterH[1] + coef3H * ButterH[2];
def a1I = exp(-1.414 * 3.14159 / Period9);
def b1I = 2 * a1I * Cos(1.414 * 3.14159 / Period9);
def coef2I =b1I;
def coef3I = -a1I * a1I;
def coef1I = (1 – b1I + a1I * a1I) / 4;
rec ButterI = if barNumber() < 3 then Price else coef1I * (Price + 2 * Price[1] + Price[2]) + coef2I * ButterI[1] + coef3I * ButterI[2];
def a1J = exp(-1.414 * 3.14159 / Period10);
def b1J = 2 * a1J * Cos(1.414 * 3.14159 / Period10);
def coef2J =b1J;
def coef3J = -a1J * a1J;
def coef1J = (1 – b1J + a1J * a1J) / 4;
rec ButterJ = if barNumber() < 3 then Price else coef1J * (Price + 2 * Price[1] + Price[2]) + coef2J * ButterJ[1] + coef3J * ButterJ[2];
def a1K = exp(-1.414 * 3.14159 / Period11);
def b1K = 2 * a1K * Cos(1.414 * 3.14159 / Period11);
def coef2K =b1K;
def coef3K = -a1K * a1K;
def coef1K = (1 – b1K + a1K * a1K) / 4;
rec ButterK = if barNumber() < 3 then Price else coef1K * (Price + 2 * Price[1] + Price[2]) + coef2K * ButterK[1] + coef3K * ButterK[2];
def a1L = exp(-1.414 * 3.14159 / Period12);
def b1L = 2 * a1L * Cos(1.414 * 3.14159 / Period12);
def coef2L =b1L;
def coef3L = -a1L * a1L;
def coef1L = (1 – b1L + a1L * a1L) / 4;
rec ButterL = if barNumber() < 3 then Price else coef1L * (Price + 2 * Price[1] + Price[2]) + coef2L * ButterL[1] + coef3L * ButterL[2];
plot A1_Dot = if IsNaN(Close) then Double.NaN else 1;
A1_Dot.SetPaintingStrategy(PaintingStrategy.TRIANGLES);
A1_Dot.SetLineWeight(DotSize);
A1_Dot.AssignValueColor(if ButterA >= ButterA[1] then Color.Cyan else Color.Magenta);
plot A2_Dot = if IsNaN(Close) then Double.NaN else 2;
A2_Dot.SetPaintingStrategy(PaintingStrategy.TRIANGLES);
A2_Dot.SetLineWeight(DotSize);
A2_Dot.AssignValueColor(if ButterB >=ButterB[1] then Color.Cyan else Color.Magenta);
plot A3_Dot = if IsNaN(Close) then Double.NaN else 3;
A3_Dot.SetPaintingStrategy(PaintingStrategy.TRIANGLES);
A3_Dot.SetLineWeight(DotSize);
A3_Dot.AssignValueColor(if ButterC >=ButterC[1] then Color.Cyan else Color.Magenta);
plot A4_Dot = if IsNaN(Close) then Double.NaN else 4;
A4_Dot.SetPaintingStrategy(PaintingStrategy.TRIANGLES);
A4_Dot.SetLineWeight(DotSize);
A4_Dot.AssignValueColor(if ButterD >=ButterD[1] then Color.Cyan else Color.Magenta);
plot A5_Dot = if IsNaN(Close) then Double.NaN else 5;
A5_Dot.SetPaintingStrategy(PaintingStrategy.TRIANGLES);
A5_Dot.SetLineWeight(DotSize);
A5_Dot.AssignValueColor(if ButterE >=ButterE[1] then Color.Cyan else Color.Magenta);
plot A6_Dot = if IsNaN(Close) then Double.NaN else 6;
A6_Dot.SetPaintingStrategy(PaintingStrategy.TRIANGLES);
A6_Dot.SetLineWeight(DotSize);
A6_Dot.AssignValueColor(if ButterF >=ButterF[1] then Color.Cyan else Color.Magenta);
plot B7_Dot = if IsNaN(Close) then Double.NaN else 7;
B7_Dot.SetPaintingStrategy(PaintingStrategy.TRIANGLES);
B7_Dot.SetLineWeight(DotSize);
B7_Dot.AssignValueColor(if ButterG >=ButterG[1] then Color.Blue else Color.Red);
plot B8_Dot = if IsNaN(Close) then Double.NaN else 8;
B8_Dot.SetPaintingStrategy(PaintingStrategy.TRIANGLES);
B8_Dot.SetLineWeight(DotSize);
B8_Dot.AssignValueColor(if ButterH >=ButterH[1] then Color.Blue else Color.Red);
plot B9_Dot = if IsNaN(Close) then Double.NaN else 9;
B9_Dot.SetPaintingStrategy(PaintingStrategy.TRIANGLES);
B9_Dot.SetLineWeight(DotSize);
B9_Dot.AssignValueColor(if ButterI >=ButterI[1] then Color.Blue else Color.Red);
plot B10_Dot = if IsNaN(Close) then Double.NaN else 10;
B10_Dot.SetPaintingStrategy(PaintingStrategy.TRIANGLES);
B10_Dot.SetLineWeight(DotSize);
B10_Dot.AssignValueColor(if ButterJ >=ButterJ[1] then Color.Blue else Color.Red);
plot B11_Dot = if IsNaN(Close) then Double.NaN else 11;
B11_Dot.SetPaintingStrategy(PaintingStrategy.TRIANGLES);
B11_Dot.SetLineWeight(DotSize);
B11_Dot.AssignValueColor(if ButterK >=ButterK[1] then Color.Blue else Color.Red);
plot B12_Dot = if IsNaN(Close) then Double.NaN else 12;
B12_Dot.SetPaintingStrategy(PaintingStrategy.TRIANGLES);
B12_Dot.SetLineWeight(DotSize);
B12_Dot.AssignValueColor(if ButterL >=ButterL[1] then Color.Blue else Color.Red);
AssignPriceColor(if paintbars == 1 and ButterA > ButterA[1] then Color.Cyan else if paintbars == 1 and ButterA < ButterA[1] then Color.Magenta else if paintbars == 2 and ButterB > ButterB[1] then Color.Cyan else if paintbars == 2 and ButterB < ButterB[1] then Color.Magenta else if paintbars == 3 and ButterC > ButterC[1] then Color.Cyan else if paintbars == 3 and ButterC < ButterC[1] then Color.Magenta else if paintbars == 4 and ButterD > ButterD[1] then Color.Cyan else if paintbars == 4 and ButterD < ButterD[1] then Color.Magenta else
if paintbars == 5 and ButterE > ButterE[1] then Color.Cyan else if paintbars == 5 and ButterE < ButterE[1] then Color.Magenta else if paintbars == 6 and ButterF > ButterF[1] then Color.Cyan else if paintbars == 6 and ButterF < ButterF[1] then Color.Magenta else if paintbars == 7 and ButterG > ButterG[1] then Color.Blue else if paintbars == 7 and ButterG < ButterG[1] then Color.Red else if paintbars == 8 and ButterH > ButterH[1] then Color.Blue else if paintbars == 8 and ButterH < ButterH[1] then Color.Red else
if paintbars == 9 and ButterI > ButterI[1] then Color.Blue else if paintbars == 9 and ButterI < ButterI[1] then Color.Red else if paintbars == 10 and ButterJ > ButterJ[1] then Color.Blue else if paintbars == 10 and ButterJ < ButterJ[1] then Color.Red else if paintbars == 11 and ButterK > ButterK[1] then Color.Blue else if paintbars == 11 and ButterK < ButterK[1] then Color.Red else if paintbars == 12 and ButterL > ButterL[1] then Color.Blue else if paintbars == 12 and ButterL < ButterL[1] then Color.Red else color.Current);

You will notice that the second version has more lag
KYtJLFc.png
 
Last edited by a moderator:
@henry1224 - Thanks for this. When I read the code, I think that the final AssignPriceColor statement doesn't do anything because there are no price bars on the lower window. Is this interpretation correct? Thanks
 
@henry1224 - Thanks for this. When I read the code, I think that the final AssignPriceColor statement doesn't do anything because there are no price bars on the lower window. Is this interpretation correct? Thanks
Open a blank chart, Plot the indicator, click on the beaker, Click on the gear next to the indicator name, look for the Paintbars input and change from 0 to 1, click ok You will see the PRICE bars change their color to match Line 1. change it to 3 and the bars will change color to reflect line 3.

You can only have 1 indicator assign price color at a time. It is a cheap way to view how a line performs on the price window.
 
Hi, I'm trying to set up a scanner with some criteria.... im trying to find pullbacks .... also to look for possible reversals...
Mostly just before a reversal the Previous Day its a big sell off... like 85%-90% the Volume its red... all the sellers sold and might leave the party... so If it opens green. I would like to compare the volume.
How can I compare that the current day (today's volume) it has more buyers. that means... its a green volume... or the volume for the sellers are small comparing to the previous days?

I appreciate any help

thank you!
 
@adarty73
You understand that
Buyers and Sellers is not information available in the data feeds, right?
The scripts discussed here are representative of the upticks and downticks of PRICE on the trading chart not volume.

We create a percentage for buying and selling pressure by using the candlestick pattern.
When we discuss Volume. We are discussing the size of the candle.
We then apply these percentages to the volume bars in an attempt to define momentum not actual buyers and sellers.

So your big sell off is actually asking for a significant change in the size of today's red candle compared to yesterday's red candle
nOnSBvp.png
uwFHET6.png


Colored in orange are your words translated to ToS syntax:
Rich (BB code):
# Comparison of Volume Pressure
# @adarty73 3/27/22
# How I interpreted your request:
def Buying = volume * (close - low) / (high - low);
def Selling = volume * (high - close) / (high - low);

#compare  the current day (today's volume) it has more buyers.
def Buyup = buying > buying from 1 bar ago ;
def BuyPCT = Round((Buying/(Buying+Selling))*100,2) ;
# or

#the volume for the sellers are small comparing to the previous day
def Selldn = selling < selling from 1 bar ago ;
def SellPCT = Round((Selling/(Selling+Buying))*100,2) ;

#Mostly just before a reversal the Previous Day its a big sell off... like 85%-90%
def BigSellOff = SellPCT from 1 bar ago > 85;

#So your trigger for this study is:  If Buyer Volume is up or Seller Volume is down and there was a bigSellOff yesterday
plot trigger = (Buyup or Selldn) and bigSellOff ;
     trigger.hide();

AddLabel(trigger,
"Today's Buying:  "  + AsPercent(Buying/(Buying+Selling))  +"  vs  Yesterday's  "+ AsPercent(Buying[1]/(Buying[1]+Selling[1])) +" | "+
"Today's Selling:  " + AsPercent(Selling/(Selling+Buying)) +"  vs  Yesterday's  "+ AsPercent(Selling[1]/(Selling[1]+Buying[1]))
 , color.blue );

PS: Lower Indicator script is in top post
3pvqgEk.png
 

Attachments

  • nOnSBvp.png
    nOnSBvp.png
    18.9 KB · Views: 1,269
Last edited:
Hi there, im creating a scanner with certain criteria... one of the condition is to know that the previous day the volume is completellly red or 90% .... because I want to know when the sellers are leaving after a big retracement...is there any way how to measure that?

i really appreciate your help
arlette


Thinkscript can't read time and sales data. So the best we can do is approximate buy and sell volume, based on the candle close position, to create a ratio

this was copied from the 2nd study, in the link below

Code:
def O = open;
def H = high;
def C = close;
def L = low;
def V = volume;
def buying = V*(C-L)/(H-L);
def selling = V*(H-C)/(H-L);

https://usethinkscript.com/threads/...r-pocs-for-thinkorswim.8153/page-9#post-83255
click on expand
2nd study
and VolumeRatio:
 
Hello - Been a lurker for a long time. This has been an incredible resource but there is one thing I cannot find for TOS and am curious if anyone knows and can code what seems like an easy one? I can't seem to piece it together... although I do have it on TC2000.

I want two columns in my watch-list. One column shows BUY VOLUME and the other shows SELL VOLUME based on this:

def O = open;
def H = high;
def C = close;
def L = low;
def V = volume;
def buying = V*(C-L)/(H-L);
def selling = V*(H-C)/(H-L);


I have the all-in-one histogram version BUT I would like to break the histogram version down into two separate, custom columns for my watch-list so I can see approximate volume as it happens. I would think this could be done since all the data is there?

I've seen a watch-list code on this site where the coder made something similar but it was in % with colors green and red and only a single column.

I have tried several codes and mashed some together but I cannot get the result that I am seeking for either a BUY VOLUME column or a SELL VOLUME column.

If a coder can create this it would be pretty terrific. Thank You.

PS This link gave me the idea as the volume as all the buy sell data in it... basically. Not absolutely perfect. https://tos.mx/KiAqx33
 
Last edited by a moderator:
Hello OneManTrading! I think I have a solution for you. These are two separate charts, one for buying volume and one for selling volume. Just add each link to each individual chart. Hope this helps and have a great day!!
Rich (BB code):
declare lower;


def O = open;

def H = high;

def C = close;

def L = low;

def V = volume;

def Buying = V*(C-L)/(H-L);

def Selling = V*(H-C)/(H-L);


# Selling Volume

Plot SV = selling;

 SV.setPaintingStrategy(PaintingStrategy.Histogram);

SV.SetDefaultColor(Color.Red);

SV.HideTitle();

SV.HideBubble();

SV.SetLineWeight(5);
Screenshot-at-Apr-07-21-21-08.png

Rich (BB code):
declare lower;


def O = open;

def H = high;

def C = close;

def L = low;

def V = volume;

def Buying = V*(C-L)/(H-L);

def Selling = V*(H-C)/(H-L);


# Buying Volume

# Plot BV = Buying;

# Note that Selling + Buying Volume = Volume.

Plot BV =  volume;

 BV.setPaintingStrategy(PaintingStrategy.Histogram);

BV.SetDefaultColor(Color.Dark_Green);

BV.HideTitle();

BV.HideBubble();

BV.SetLineWeight(5);


Links: Selling Volume
Buying Volume
 
Last edited by a moderator:
@Izzylbs -Thank you for your input. It is appreciated. When I tried the basic code to be based off, I would simply get the days total volume. When I mashed some other codes in, I got the same thing. I would only put just buy volume in or just sell volume and the volume would default to the days entire volume. I don't know much code besides html and some workarounds... putting two and two together or a youtube lesson here and there.

I have a volume histogram that already shows buys, sells and total volume all in one. I will stick with that for my histogram on my chart. If wondering about it, it's in the link I provided in my first thread. I find that particular volume histogram very helpful. Maybe you'd like it too. Betting you've probably seen it though.

Cheers, friend!
 
as stated:
@onemantrading
Buyers and Sellers is not information available in the data feeds.
The scripts discussed here are representative of the upticks and downticks of PRICE on the trading chart not volume.

We create a percentage for buying and selling pressure by using the candlestick pattern.
When we discuss Volume. We are discussing the size of the candle.
We then apply these percentages to the volume bars in an attempt to define momentum not actual buyers and sellers.

You can't apply the momentum percentage to the volume number and declare that to be the number of buyers and sellers.
nOnSBvp.png
uwFHET6.png
 

Attachments

  • nOnSBvp.png
    nOnSBvp.png
    18.9 KB · Views: 1,147
Last edited:
If I may ask as a newbie, what are the benefits of knowing the Volume numbers? What is this helping you in getting more wins?
 
@MerryDay - I understand.

On TC2000, the numbers displayed don't match the actual total daily volume or when added together, don't match up either but it's the best I believe that I can get when it comes to a column of buys and sells volume ("pressure")... at least from what I've seen.

TC2000 basically said the same thing but it's what I got. Apparently the actual buy and sell volume is hard to come by? If anyone knows a better way for actual volume in columns... buys and sells... I would like to see it. Volume, in my experience, is king besides market structure and overall daily direction of the larger markets.

Thank you, MerryDay. I do appreciate you chiming in and throwing this down. Really super cool!!
 
@MerryDay - I understand.
Volume, in my experience, is king besides market structure and overall daily direction of the larger markets.
If I may ask as a newbie, what are the benefits of knowing the Volume numbers? What is this helping you in getting more wins?

Volume drives price.
The thinking is to filter your corral of eligible stocks by the standard of Average(volume,50) > 1000000. Thus making sure you are picking the stocks being traded by the Industrial Traders and Algos as they are who move markets. AND THEN look at the buying /selling percentages to see who is in charge.

I keep the Chris Enhanced Labels on my chart, gives me totally daily volume and who is in charge by percentage. I overlay my labels on the Better Volume Indicator as modified by @netarchitech so I can eyeball unusual activity.
Everyone should choose the volume indicator that best suits their style. I use @netarchitech because I am a Price Action Trader which he incorporates into his script.
Read more about Better Volume: https://usethinkscript.com/threads/better-volume-indicator-for-thinkorswim.108/
Read more about Price Action: https://usethinkscript.com/threads/price-action-toolbox-for-thinkorswim.10747/

B2U0olR.png

My Chris Enhanced Labels:
Ruby:
#Chris' Enhanced Volume V.2 /w Uptick/Downtick
#streamlined by @MerryDay 2/2020 only displays Daily Volume and who is in charge
declare lower;
declare real_size ;
##############################
# UPTICK / DOWNTICK CRITERIA #
##############################
input VolAgg = AggregationPeriod.DAY ;
def Buying = volume * (close - low) / (high - low);
def Selling = volume * (high - close) / (high - low);
def DailyVol = volume("period" = VolAgg);
def AvgVol = Average(DailyVol,50) ;
#################
# Formatting
#################
DefineGlobalColor("LabelGreen",  CreateColor(0, 165, 0)) ;

AddLabel(yes, "AvgVol = " +Round(AvgVol,0) +" | " +"DailyVol = " + Round(DailyVol, 0), color.violet);
AddLabel(buying>selling, "Buy %: " + Round((Buying/(Buying+Selling))*100,2) ,  GlobalColor("LabelGreen"));
AddLabel(selling>buying, "Sell %: " + Round((Selling/(Selling+Buying))*100,2) , color.RED);

plot scan = Buying > Selling ;
     scan.hide();
 
Last edited:

Similar threads

Not the exact question you're looking for?

Start a new thread and receive assistance from our community.

87k+ Posts
341 Online
Create Post

Similar threads

Similar threads

The Market Trading Game Changer

Join 2,500+ subscribers inside the useThinkScript VIP Membership Club
  • Exclusive indicators
  • Proven strategies & setups
  • Private Discord community
  • ‘Buy The Dip’ signal alerts
  • Exclusive members-only content
  • Add-ons and resources
  • 1 full year of unlimited support

Frequently Asked Questions

What is useThinkScript?

useThinkScript is the #1 community of stock market investors using indicators and other tools to power their trading strategies. Traders of all skill levels use our forums to learn about scripting and indicators, help each other, and discover new ways to gain an edge in the markets.

How do I get started?

We get it. Our forum can be intimidating, if not overwhelming. With thousands of topics, tens of thousands of posts, our community has created an incredibly deep knowledge base for stock traders. No one can ever exhaust every resource provided on our site.

If you are new, or just looking for guidance, here are some helpful links to get you started.

What are the benefits of VIP Membership?
VIP members get exclusive access to these proven and tested premium indicators: Buy the Dip, Advanced Market Moves 2.0, Take Profit, and Volatility Trading Range. In addition, VIP members get access to over 50 VIP-only custom indicators, add-ons, and strategies, private VIP-only forums, private Discord channel to discuss trades and strategies in real-time, customer support, trade alerts, and much more. Learn all about VIP membership here.
How can I access the premium indicators?
To access the premium indicators, which are plug and play ready, sign up for VIP membership here.
Back
Top