#BonBon - Heiken_Ashi based on Sylvan Verboort's Trading with HA Candlestick Oscillator
#Bon Bon _last update 2/1/2021, Jan 17th 2021,
#Influenced by script from HoboTheClown / blt,http://www.thinkscripter.com, TD Hacolt etc., Thinkscript Cloud, TOS & Thinkscript Collection
#update 1/2/21 - changed the default moving average to TEMA.  Changed the period to 35.
#update changed reversal arrows to reversal bubbles with price
#PLEASE DO NOT REMOVE THE HASHTAGS!!!! ONLY REMOVE THEM IF YOU PLAN ON USING THAT PARTICULAR SIGNAL. THERE ARE 3 DIFFERENT SIGNALS IN THE SCRIPT!!!!! IF YOU REMOVE ALL THE HASHTAGS YOU WILL HAVE NUMEROUS SIGNALS ON YOUR CHART!!!!!!!!!

input averagelength = 34;
input percentamount = .01;
input revAmount = .05;
input atrlength = 4;
input period = 50;
input hideCandles = no;
input show_bubble_labels = yes;
input bubbles = yes;
input arrows = yes;
input PaintBars = yes; #Update to add paintbars
input candleSmoothing = {default Valcu, Vervoort};

input movingAverageType = {default TEMA, Exponential, Weighted, Hull, Variable, SIMPLE};

def openMA;
def closeMA;
def highMA;
def lowMA;

switch (movingAverageType) {
case Simple:
    openMA = compoundValue(1, Average(open, period), open);
    closeMA = compoundValue(1, Average(close, period), close);
    highMA = compoundValue(1, Average(high, period), high);
    lowMA = compoundValue(1, Average(low, period), low);
case Exponential:
    openMA = compoundValue(1, ExpAverage(open, period), open);
    closeMA = compoundValue(1, ExpAverage(close, period), close);
    highMA = compoundValue(1, ExpAverage(high, period), high);
    lowMA = compoundValue(1, ExpAverage(low, period), low);
case Weighted:
    openMA = compoundValue(1, WMA(open, period), open);
    closeMA = compoundValue(1, WMA(close, period), close);
    highMA = compoundValue(1, WMA(high, period), high);
    lowMA = compoundValue(1, WMA(low, period), low);
Case Hull:
    openMA = compoundValue(1, HullMovingAvg(open, period), open);
    closeMA = compoundValue(1,  HullMovingAvg(close, period), close);
    highMA = compoundValue(1,  HullMovingAvg(high, period), high);
    lowMA = compoundValue(1,  HullMovingAvg(low, period), low);
case variable:
    openMA = compoundValue(1, VariableMA(open, period), open);
    closeMA = compoundValue(1, VariableMA(close, period), close);
    highMA = compoundValue(1, VariableMA(high, period), high);
    lowMA = compoundValue(1, VariableMA(low, period), low);
case TEMA:
    openMA = compoundValue(1, TEMA(open, period), open);
    closeMA = compoundValue(1, TEMA(close, period), close);
    highMA = compoundValue(1, TEMA(high, period), high);
    lowMA = compoundValue(1, TEMA(low, period), low);
}


HidePricePlot(hideCandles);

def haOpen;
def haClose;

switch (candleSmoothing){
case Valcu:
    haOpen = CompoundValue(1, ( (haOpen[1] + (openMA[1] + highMA[1] + lowMA[1] + closeMA[1]) / 4.0) / 2.0), open);
    haClose = ((((openMA + highMA + lowMA + closeMA) / 4.0) + haOpen + Max(highMA, haOpen) + Min(lowMA, haOpen)) / 4.0);
case Vervoort:
    haOpen = CompoundValue(1, ( (haOpen[1] + (openMA[1] + highMA[1] + lowMA[1] + closeMA[1]) / 4.0 ) / 2.0), open);
    haClose = ((((openMA + highMA + lowMA + closeMA) / 4.0) + haOpen + Max(highMA, haOpen) + Min(lowMA, haOpen)) / 4.0);
}

plot o = haOpen ;
o.Hide();

def haLow =  Min(lowMA, haOpen);
def haHigh = Max(highMA, haOpen);
#############################################################################################

#Medium-term price reversals - upward trend

def avg = 34;
def TMA1 = reference TEMA(haClose, avg); # triple exponential moving average (TEMA) of 34 bars
def TMA2 =  reference TEMA(TMA1, avg);
def Diff = TMA1 - TMA2;
def ZlHa = TMA1 + Diff; #Zero-lagging TEMA average on closing prices - medium term uptrend; plot line magenta
#def shortCandle = BodyHeight() < (high - low) * candleSizeFactor; #code taken from HACOLT
#Medium-term price reversals - downward trend
def avg2 = 34;
def TMA1_ = reference TEMA((high + low) / 2, avg2);
def Diff2 = TMA1_ - TMA2;
def ZlCl = TMA1_ + Diff2; #Zero-lagging TEMA average on closing prices - medium term doenwardtrend ....plot line yellow;

def ZlDif = ZlCl - ZlHa; # Zero-Lag close - Zero-Lag HA(green candle) Uptrend when ZlDif is equal to or greater than zero

#AssignPriceColor(if haclose >= haopen
               # then Color.GREEN else
                # if haclose < haopen
                # then Color.RED else color.white);

#####################################################################################################
input charttype = ChartType.CANDLE;

def haopen_ = if haClose <= haOpen
              then haOpen + 0
              else Double.NaN;

def HAhi   = if haClose <= haOpen
              then haHigh
              else Double.NaN;

def HAlo =   if haClose <= haOpen
              then haLow
              else Double.NaN;

AddChart(growColor = Color.RED, neutralColor = Color.CURRENT, high = HAhi, low = HAlo, open = haopen_, close = haClose, type = ChartType.CANDLE);

def HAclose1 = ohlc4;
def HAopen1  = if haClose >= haOpen
               then CompoundValue(1, (haOpen[1] + haClose[1]) / 2, (open[1] + close[1]) / 2)
               else Double.NaN;

def haopen_1 = if haOpen <= haClose
               then HAopen1 + 0  else Double.NaN;

def HAhigh1  = haHigh;
def HAlow1   = haLow;

AddChart(growColor = Color.GREEN, neutralColor = Color.CURRENT,  high = HAhigh1, low = HAlow1, open = haopen_1, close = haClose, type = ChartType.CANDLE);

#####################################################################################################
def trend = if haClose >= haOpen then 1 else 0; # halow1[-50]
#plot trendup =  trend and !trend[1];
#trendup.SetPaintingStrategy(PaintingStrategy.BOOLEAN_ARROW_UP);
#trendup.SetDefaultColor(Color.GREEN);
#trendup.SetLineWeight(5);

def Trendd =  if haClose < haOpen then 1 else 0;
#plot trendDown = Trendd and !Trendd[1] ;
#trendDown.SetDefaultColor(Color.RED);
#trendDown.SetPaintingStrategy(PaintingStrategy.BOOLEAN_ARROW_DOWN);
#trendDown.SetLineWeight(5);

#AddChartBubble(bubbles and trendup  and trendup , HAlow1, ("R$:"  + Round(HAlow1, 2)), Color.CYAN, no);
#AddChartBubble(bubbles and trendDown and trendDown , HAhi, ("R$:"  + Round(HAhi, 2)), Color.CYAN, yes);
########################################################################
#End of HA_Smoothing Script

#Signals
#Original code by Taz43
#updated by BonBon 1/15/21 inccreased swing_back periods, changed "high and Low to Halow1 and Hahigh1".  Included price labels/bubbles.

def bubbles2 = yes;
input swing_back = 20;
input swing_forward = 34;
input swinglow_back = 20;
input swinglow_forward = 34;
input maxbars = 50;
input showlevels = Yes;
def sb = swing_back;
def sf = swing_forward;
def sb2 = swinglow_back;
def sf2 = swinglow_forward;
def na = Double.NaN;

def Offset4 =  8; # high(period = "day")and low(period = "day" ) and close(period = "day" ) * 0.03;
def bubblelocation = bubbles2[Offset4];

def lfor2 = Lowest(haLow, sf2)[-sf2]; #Remember that a negative number inside the square brackets means "after" this bar. So, the above line is defining "lfor" as being the lowest value of the two bars after this bar.
def lback2 = Lowest(haLow, sb2)[1]; #This line of code is defining "lback" as the lowest value of the eight bars before this one.

def swinglow2 = if haLow < lfor2 and haLow < lback2 then 1 else 0;
#Finally, this line is actually defining what a "swing low" is. It says, if the low of this bar is lower than the two bars after this one AND the low of this bar is also lower than or equal to the lowest of the previous eight bars, then this bar is a swing low. So, what that means is that in order to determine whether a point on the chart is either a swing high or a swing low, it must have eight bars before the bar in question, as well as, two bars after it. Looking at the picture above, it can be seen that point "A" is a "swing high" because it is higher than the 8 bars before it AND it is higher than the 2 bars after it. Likewise, point "C" is a "swing low" because it is lower than the 8 bars before it AND it is lower than the 2 bars after it. (I know it's a line chart, not a bar chart. smiling smiley Just work with me here.)

plot sl = if swinglow2 then haLow else na;
#sl.SetPaintingStrategy(PaintingStrategy.POINTS);
sl.SetDefaultColor(Color.WHITE);
sl.SetLineWeight(5);

def hfor = Highest(haHigh, sf)[-sf];
def hback = Highest(haHigh, sb)[1];

def swinghigh2 = if haHigh > hfor  and haHigh > hback then 1 else 0;
plot sh = if swinghigh2 then haHigh else na ;
#sh.SetDefaultColor(Color.orange);
#sh.SetPaintingStrategy(PaintingStrategy.POINTS);
sh.SetLineWeight(5);

plot fh = if swinghigh2 then haHigh else na ;
fh.SetDefaultColor(Color.MAGENTA);
#fh.SetPaintingStrategy(PaintingStrategy.booleaN_ARROW_DOWN);
fh.SetLineWeight(5);

plot fl = if swinglow2 then HAlo else na;
#fl.SetPaintingStrategy(PaintingStrategy.boolean_ARROW_UP);
fl.SetDefaultColor(Color.LIME);
fl.SetLineWeight(5);

#AddChartBubble(bubbles2 and fl and fl , HAlo, ("$:"  + Round(HAlo, 2)), Color.lime, no);
#AddChartBubble(bubbles2 and fh and fh , HAhigh, ("$:"  + Round(HAhigh, 2)), Color.magenta, yes);
#######################################################################
#Signals

###Ameritrade Thinkscript
#ZigZagHighLow High Low
#updated by BonBon 1/18/21 inccreased pivot lengths and  periods, changed "high and Low to Halow1 and Hahigh1".  Included price labels/bubbles.

def priceH = HAhigh1;
def priceL = HAlow1;
input atrreversal = 2.0;
def atr_atrreversal = atrreversal;
input tickReversal = 0;

#The minimum percentage of price change for a swing to be detected.
input percentageReversal = 5.0;
#Additional value in dollars that can be added to the minimum price change and  ATR change to increase the distance between swing points.
input absoluteReversal = 0.0;
#The period for ATR calculation.
#input atrLength = 5;
#The factor by which the ATR value is multiplied.
#input atrReversal = 1.5;
#tick reversal- Additional value in ticks that can be added to the minimum price change and ATR change to increase the distance between swing points.
#input tickReversal = 0;

Assert(percentageReversal >= 0, "'percentage reversal' must not be negative: " + percentageReversal);
Assert(absoluteReversal >= 0, "'absolute reversal' must not be negative: " + absoluteReversal);
Assert(atrreversal >= 0, "'atr reversal' must not be negative: " + atrreversal);

Assert(percentageReversal != 0 or absoluteReversal != 0 or atrreversal != 0 or tickReversal != 0, "Either 'percentage reversal' or 'absolute reversal' or 'atr reversal' or 'tick reversal' must not be zero");

#Additional value in dollars that can be added to the minimum price change and  ATR change to increase the distance between swing points.
def absReversal;
if (absoluteReversal != 0) {
    absReversal = absoluteReversal;
} else {
    absReversal =  tickReversal * TickSize();
}

def hlPivot;
if (atrreversal != 0) {
    hlPivot = percentageReversal / 300 + WildersAverage(TrueRange(haHigh, haClose, haLow), atrlength) / haClose * atrreversal;
} else {
    hlPivot = percentageReversal / 300;
}
def state = {default init, undefined, uptrend, downtrend};
def maxPriceH;
def minPriceL;
def newMax;
def newMin;
def prevMaxH = GetValue(maxPriceH, 1);
def prevMinL = GetValue(minPriceL, 1);

if GetValue(state, 1) == GetValue(state.init, 0) {
    maxPriceH = priceH;
    minPriceL = priceL;
    newMax = yes;
    newMin = yes;
    state = state.undefined;
} else if GetValue(state, 1) == GetValue(state.undefined, 0) {
    if priceH >= prevMaxH {
        state = state.uptrend;
        maxPriceH = priceH;
        minPriceL = prevMinL;
        newMax = yes;
        newMin = no;
    } else if priceL <= prevMinL {
        state = state.downtrend;
        maxPriceH = prevMaxH;
        minPriceL = priceL;
        newMax = no;
        newMin = yes;
    } else {
        state = state.undefined;
        maxPriceH = prevMaxH;
        minPriceL = prevMinL;
        newMax = no;
        newMin = no;
    }
} else if GetValue(state, 1) == GetValue(state.uptrend, 0) {
    if priceL <= prevMaxH - prevMaxH * hlPivot - absReversal {
        state = state.downtrend;
        maxPriceH = prevMaxH;
        minPriceL = priceL;
        newMax = no;
        newMin = yes;
    } else {
        state = state.uptrend;
        if (priceH >= prevMaxH) {
            maxPriceH = priceH;
            newMax = yes;
        } else {
            maxPriceH = prevMaxH;
            newMax = no;
        }
        minPriceL = prevMinL;
        newMin = no;
    }
} else {
    if priceH >= prevMinL + prevMinL * hlPivot + absReversal {
        state = state.uptrend;
        maxPriceH = priceH;
        minPriceL = prevMinL;
        newMax = yes;
        newMin = no;
    } else {
        state = state.downtrend;
        maxPriceH = prevMaxH;
        newMax = no;
        if (priceL <= prevMinL) {
            minPriceL = priceL;
            newMin = yes;
        } else {
            minPriceL = prevMinL;
            newMin = no;
        }
    }
}

def barNumber = BarNumber();
def barCount = HighestAll(If(IsNaN(priceH), 0, barNumber));
def newState = GetValue(state, 0) != GetValue(state, 1);
def offset = barCount - barNumber + 1;
def highPoint = state == state.uptrend and priceH == maxPriceH;
def lowPoint = state == state.downtrend and priceL == minPriceL;

plot lastH;
if highPoint and offset > 1 {
    lastH = fold iH = 1 to offset with tH = priceH while !IsNaN(tH) and !GetValue(newState, -iH) do if GetValue(newMax, -iH) or iH == offset - 1 and GetValue(priceH, -iH) == tH then Double.NaN else tH;
} else {
    lastH = Double.NaN;
}

plot lastL;
if lowPoint and offset > 1 {
    lastL = fold iL = 1 to offset with tL = priceL while !IsNaN(tL) and !GetValue(newState, -iL) do if GetValue(newMin, -iL) or iL == offset - 1 and GetValue(priceL, -iL) == tL then Double.NaN else tL;
} else {
    lastL = Double.NaN;
}
#Zig Zag Line
#def HA;
#if barNumber == 1 {
   # HA = fold iF = 1 to offset with tP = Double.NaN while IsNaN(tP) do if GetValue(state, -iF) == #GetValue(state.uptrend, 0) then priceL else if GetValue(state, -iF) == GetValue(state.downtrend, 0) #then priceH else Double.NaN;
#} else if barNumber == barCount {
  #  HA = if highPoint or state == state.downtrend and priceL > minPriceL then priceH else if lowPoint #or state == state.uptrend and priceH < maxPriceH then priceL else Double.NaN;
#} else {
   # HA = if !IsNaN(lastH) then lastH else if !IsNaN(lastL) then lastL else Double.NaN;
#}
#HA.SetDefaultColor(GetColor(1));
#HA.EnableApproximation();

#plots up and down arrows
#lasth.SetPaintingStrategy(PaintingStrategy.BOOLEAN_ARROW_DOWN);
#lasth.SetDefaultColor(Color.yellow);
#lasth.SetLineWeight(5);

#lastl.SetPaintingStrategy(PaintingStrategy.BOOLEAN_ARROW_UP);
#lastl.SetDefaultColor(Color.yellow);
#lastl.SetLineWeight(5);

#AddChartBubble(bubbles and lastL and lastL, HAlow1, ("$:"  + Round(HAlow1, 2)), Color.YELLOW, no);
#AddChartBubble(bubbles and lastH and lastH, HAhigh1, ("$:"  + Round(HAhigh1, 2)), Color.YELLOW, yes);
####################################################################################
#Signals

#Thinkscript cloud - Mobius/Robert Payne
#updated BonBon 1/26/2021 - changed the default settings for the swinglows.  Also changed to incorporate the HA Smoothing charttype settings.

#Here is the script for swing high and swing low. Swing high is marked by red arrow and swing low by green arrow. You can change it to dots by changing boolean_arrow_down to points. You can change the size by changing setlineweight to 2,3,4, or 5. The default setting to determine swing high/low is 3 candles but you can change that in edit properties.

input HA_swinglow = 45;
input HA_swinghigh = 45;

# define and plot the most recent high

def HA_trend = HAhigh1 >= Highest(HAhigh1[1], HA_swinghigh) and HAhigh1 >= Highest(HAhigh1[- HA_swinghigh], HA_swinghigh);
def HA_signal1 = if BarNumber() < HA_swinghigh then Double.NaN else if HA_trend then HAhigh1 else Double.NaN;
plot HATrend = HA_signal1;
        #HATrend.SetPaintingStrategy(PaintingStrategy.BOOLEAN_ARROW_DOWN);
HATrend.SetDefaultColor(Color.DOWNTICK);
HATrend.SetLineWeight(5);

# define and plot the most recent low

def HA_trend2 = HAlow1 <= Lowest(HAlow1[1],  HA_swinglow) and HAlow1 <= Lowest(HAlow1[-  HA_swinglow],  HA_swinglow);
def HA_signal2 = if BarNumber() <  HA_swinglow then Double.NaN else if HA_trend2 then HAlow1 else Double.NaN;
plot HATrend2 = HA_signal2;
      # HATrend2.SetPaintingStrategy(PaintingStrategy.BOOLEAN_ARROW_UP);
       # HATrend2.SetDefaultColor(Color.UPTICK);
       # HATrend2.SetLineWeight(5);

AddChartBubble(bubbles and HATrend2 and HATrend2, HAlow1, ("$:"  + Round(HAlow1, 2)), Color.LIME, no);
AddChartBubble(bubbles and HATrend and HATrend, HAhigh1, ("$:"  + Round(HAhigh1, 2)), Color.MAGENTA, yes);

#End code
#################################################


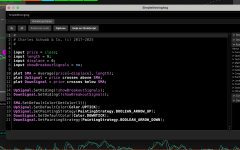
 I've circled two separate instances where I'd want for this alert to "fire" after the candles have closed. Is this possible? I'm surely hoping that it is, and I'm happy to try and learn how to fish if anyone has resources I could reference. Open to any and all feedback/suggestions, literal solutions, etc. TYIA!