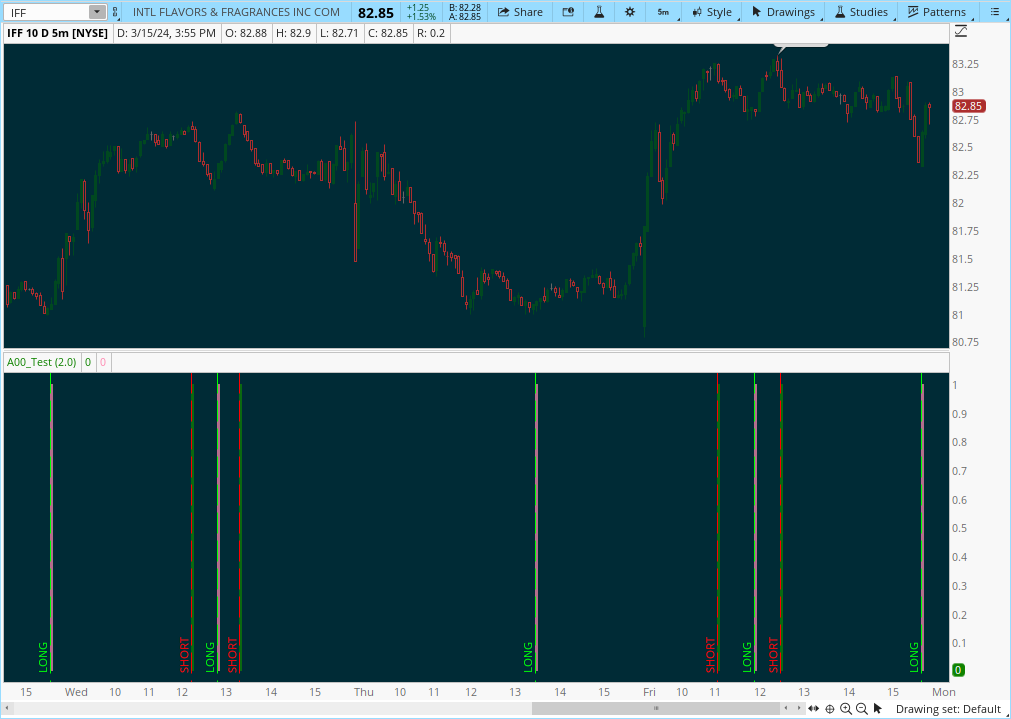
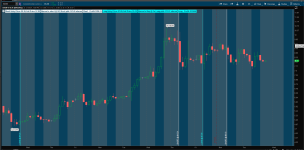
Several have asked if there is a way to make the vertical line edition of this indicator thicker, but of course there is not. I would like them thicker as well. In addition to using my upper vertical lines I made a lower Histogram to more easily catch the eye. Even though this indicator will repaint it has been the most accurate indicator I use. I typically day trade the SPY and/or QQQs on a 5 min. Daily Chart, although this is AsGoodAsItGets on most stocks or ETFs you trade.

Here is the code:

Here is the code:
Ruby:
# AsGoodAsItGets Lower Indicator
#CSR Buy/Sell Arrows with Short/Long Bubbles
#Developed 4-23-23 First Edition 8-23-22 Revised
#Updated 3/16/24 by C. Ricks

declare lower;

input atrreversal = 2.0;

def priceh = MovingAverage(AverageType.EXPONENTIAL, high, 5);
def pricel = MovingAverage(AverageType.EXPONENTIAL, low, 5);

def EIL = ZigZagHighLow("price h" = priceh, "price l" = pricel, "percentage reversal" = .01, "absolute reversal" = .05, "atr length" = 5, "atr reversal" = atrreversal).lastL;
def EIH = ZigZagHighLow("price h" = priceh, "price l" = pricel, "percentage reversal" = .01, "absolute reversal" = .05, "atr length" = 5, "atr reversal" = atrreversal).lastH;

plot signaldown = !isNAN(EIH);
signaldown.SetPaintingStrategy(PaintingStrategy.SQUARED_HISTOGRAM);
signaldown.DefineColor("signaldown", Color.Red);
AddVerticalLine(!isNAN(EIH),"SHORT", color.red,curve.long_dash);

plot signalrevBot = !isNaN(EIL);

Signalrevbot.SetPaintingStrategy(PaintingStrategy.SQUARED_HISTOGRAM);
signalrevBot.DefineColor("signalrevBot", Color.GREEN);
AddVerticalLine(!isNAN(EIL),"LONG", color.Green,curve.long_dash);

##End Code
Last edited by a moderator:

