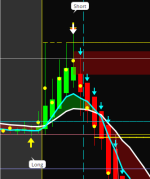
As Good As It Gets
Trading Guide & Summary
A primer on trading for the new trader (or refresher for the more advanced).
Trading Guide & Summary
A primer on trading for the new trader (or refresher for the more advanced).
AS A REFERENCE: ALL OF MY CHARTS AND POSTS:
https://usethinkscript.com/search/1...4&c[nodes][1]=5&c[title_only]=1&o=replies&g=1
Below are listed (in no particular order) subjects and issues that might be of interest to you?
First some definitions:
Indicator: in the stock market it is a quantitative tool to interpret financial data to help forecast stock price movements.
Lagging Indicator: Indicators that confirm longer term trends. They are based on historical data (on things that have already happened). They may provide information about likely future changes.
Leading Indicator: These are Indicators which show where a price might move next. When they give the correct signal they give a trader the ability to get into a trade ahead of price movement. The indicators on my AGAIG charts are intended to be leading indicators with trade recommendations only when two or more are in agreement.
SMA (Simple Moving Average) verses EMA (Exponential Moving Average): The difference in these two is in their calculation method. The EMA gives weight to current (recent) prices and is usually suited to short-term trading, whereas the SMA provides equal weight to all prices and is usually favored by longer-term traders. My AGAIG charts favor EMA for trades. Some favored EMA moving averages are the 5, 8, 13, 21, 34. Most of my charts highlight the 21 EMA by using a white 20 EMA line, watching for candles to cross over this line. Some traders trade only crossovers. The 20 EMA is a heads-up for the 21 EMA, which is a favored crossover for many algorithms and computer based trading.
Candle Types: The most frequently used Candles are Standard Candles, or Monkey Bars. My favorite (and mostly used on my AGAIG Charts is the Heikin Ashi). I find standard candles to be noisier as they are real time and unprocessed, whereas the Heikin Ashi are data filtered based on a two period moving average. I have discussed these two types of candles on My AGAIG TREND & MOMENTUM tutorial.
PIVOTS: Places where the market frequently makes changes in direction. Some of these Pivots are the 1 SD (Standard Deviation) and the Murrey Math Pivots shown on my AGAIG High Profit Options Trading Chart
VWAP Volume Weighted Average Price I have explained and show how this works on my AGAIG Daytrading the VWAP . The VWAP (Volume Weighted Average Price): Institutional traders frequently use the VWAP (Volume Weighted Average Price) primarily for intraday trading, usually on a one-minute, five-minute or fifteen-minute chart.
AI = Artificial Intelligence, which comprises most of my own. To my thinking, AI is just another indicator which extrapolates historical into the present, but is unable to tell you where the market will end today. Is it a leading indicator? I don’t think so but would like other’s thoughts on this issue?
Trading Waves: The market (Stocks, ETFs) tend to moves in waves on all time frames being used. These are frequently described as M Waves and W Waves. If you are interested in Waves, I discussed them on my AGAIG M & W Wave
The GREEKS: There are several Greeks which the market uses in establishing prices. One of these is DELTA: I explained them in AGAIG The Greeks Delta
Another necessary GREEK is THETA DECAY which I discussed under a posting titled: AGAIG The Greeks Theta Decay
It has been my assessment that there are two best trades of the day: They are explained in an AGAIG The Best Two Trades Of Each Day
Visual Options Trading: During my 10+ years of trading options it is my belief that seeing charts visually is the best method for trading. I explained my thoughts on AGIAG Visual Options Trading
Success in Options Trading is best achieved if you have a TRADING EDGE: I discussed AGIAG TRADING WITH AN “EDGE” IS THE DESIRE OF ALL TRADERS.
A trader also needs a TRADING PATH in order to be successful. I made a post showing a Trading Path using no Candles in order to better show the pathway. It is titled: AGIAG TRADING PATH CHART
You also might like my Indicators: AGIAG “GPS” System for Trading
I have developed my many trading charts which I believe are pleasing to the eye and include within them the basics as listed above.
Find all of my Charts and Tutors:
https://usethinkscript.com/search/1...4&c[nodes][1]=5&c[title_only]=1&o=replies&g=1
You will find all of my Charts and Posts designed to help you become an efficient and hopefully better trader.
Happy trading!
Last edited by a moderator:

