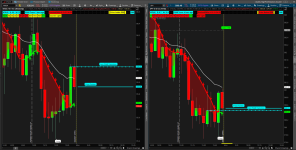
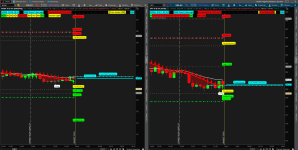
Repaints AGAIG High Profit Options Trading Chart For ThinkOrSwim

Repaints
HAHAHA. I've been doing this long enough to no there isn't any magic indicator. But , I have to say, using TOS and your charts are , well, as good as it gets. Need to be going with the flow, but as far as having an "assistant" that watches everything, this is top notch. Thank you for all your efforts . Warm regards, Mike
 
HAHAHA. I've been doing this long enough to no there isn't any magic indicator. But , I have to say, using TOS and your charts are , well, as good as it gets. Need to be going with the flow, but as far as having an "assistant" that watches everything, this is top notch. Thank you for all your efforts . Warm regards, Mike
A tablespoon of humor helps the losing trades go down!
 
Second this comment. Can you please provide more clarity on how you are using this and if it applies to all time frames or just 5m? And what do you mean 'only place trades when two or more indicators are in agreement?' . Which two indicators are you referring to?
Some time ago a couple of you asked how I use this chart (or any of my charts for that matter).

One thing I look for is the first and second changes in direction a stock (ETF) takes after the ORB (Opening Range Breakout) of the market (usually the first 15-30 minutes after open).
There is a lot of pent-up energy at market open which needs to play out (options are usually more costly during this ORB period).

It has been my experience that the first and second changes in direction after this ORB period may frequently represent the most profitable trades of the day?
The first trade then will be at, or after 10:00 a.m., with the second trade taking place after the first trade plays itself out. Frequently these first two trades will be completed before noon and, if profitable, end my trading day?

Take time and look back at some of your favorite stocks (ETFs) for the past few days and see what happened after the ORB when looking at the next two changes in direction?
 
Last edited by a moderator:
Go to the beaker to the left of the time frame you are using - click on it for dropdown to added studies and strategies...look to the right of the Traffic Light, click on the wheel and change the aggregation period to 10 minutes. If still having problems let me know?
Thanks, that worked. I just hope it doesn't change it on the 5 min chart as well. I am looking at incorporating these with another chart I am working on. They look like they could work well together, but going to take some time. I wish we could put powerpoint presentations together to explain an entry/exit and some examples of false signals.
 
Thanks, that worked. I just hope it doesn't change it on the 5 min chart as well. I am looking at incorporating these with another chart I am working on. They look like they could work well together, but going to take some time. I wish we could put powerpoint presentations together to explain an entry/exit and some examples of false signals.
If you have any issues let me know and I will try to answer and help?
 
After watching this chart for a while it would be nice to have the 4/8 line on the chart - can you do that?

I mean the 4/8 Murray Math line - how do I get that? the AGAIG Murray math indicator on the chart does not have a 4/8 line on it.

I guess I should of said the level 4 line?
 
Last edited by a moderator:
I guess I should of said the level 4 line?
These are the lines on the code which I think you are referencing:
def MMLevel8 = 8 / 8;
def MMLevel7 = 7 / 8;

def MMLevel1 = 1 / 8;
def MMLevel0 = 0 / 8;

Are you looking for a midline? If so my standard deviation lines will give you the midline as well as a 1 SD deviation either way: This is the link for that which could be added to your chart: http://tos.mx/!BhUmOttN

If this is not what you're looking for please let me know?
Great, I see it now 1 SD

Thanks
 
Is there a way to keep everything visible on the chart with automatic instead of manual? I've been able to do it on other charts, but when I do it on this one it flattens everything into a few horizontal lines.
 
Is there a way to keep everything visible on the chart with automatic instead of manual? I've been able to do it on other charts, but when I do it on this one it flattens everything into a few horizontal lines.

Now I'm at my computer.

On the upper right of a chart are two lines that look like they have a sideways S inside.
This is the Price Axis Setting.
Click on that and the dropdown will open.
If any of the boxes are checked it will probably compress your chart.

The only thing I want active is to click on the little wheel between your time setting and the beaker and click on Price Axis
(I like to check and keep Price Zoom. Click on that and hit Apply and then OK.

This should help your chart expand and not flatten.
After this if price get out of area I got to that chart Price Axis Setting and click Auto.

You can also put your pointer on the black area that shows price (on chart right sideline), right click and you can lengthen or shorten the chart view.
 
Last edited by a moderator:

Join useThinkScript to post your question to a community of 21,000+ developers and traders.

Not the exact question you're looking for?

Start a new thread and receive assistance from our community.

87k+ Posts
398 Online
Create Post

The Market Trading Game Changer

Join 2,500+ subscribers inside the useThinkScript VIP Membership Club
  • Exclusive indicators
  • Proven strategies & setups
  • Private Discord community
  • ‘Buy The Dip’ signal alerts
  • Exclusive members-only content
  • Add-ons and resources
  • 1 full year of unlimited support

Frequently Asked Questions

What is useThinkScript?

useThinkScript is the #1 community of stock market investors using indicators and other tools to power their trading strategies. Traders of all skill levels use our forums to learn about scripting and indicators, help each other, and discover new ways to gain an edge in the markets.

How do I get started?

We get it. Our forum can be intimidating, if not overwhelming. With thousands of topics, tens of thousands of posts, our community has created an incredibly deep knowledge base for stock traders. No one can ever exhaust every resource provided on our site.

If you are new, or just looking for guidance, here are some helpful links to get you started.

What are the benefits of VIP Membership?
VIP members get exclusive access to these proven and tested premium indicators: Buy the Dip, Advanced Market Moves 2.0, Take Profit, and Volatility Trading Range. In addition, VIP members get access to over 50 VIP-only custom indicators, add-ons, and strategies, private VIP-only forums, private Discord channel to discuss trades and strategies in real-time, customer support, trade alerts, and much more. Learn all about VIP membership here.
How can I access the premium indicators?
To access the premium indicators, which are plug and play ready, sign up for VIP membership here.
Back
Top