Repaints AGAIG Day Trading Chart Set-up For ThinkOrSwim

Repaints
Hi @csricksdds
For some reason the long code for the HighLoPivotPoints does not work when I paste it in my ToS. Do you have share chart link with the indicators that you use? Thanks
HighLow_TurningPointArrows not showing? Since I use a dark background the arrows are set as WHITE. If using a light background you will need a different color. The code for this link: http://tos.mx/F8IJQQU looks accurate?
 
Last edited by a moderator:
Thank you for sharing your work.
How is this different from your previous AsGoodAsItGets?
I've recently added this to my charts and it is working well. Looking at the code there are some things the same but some different.
 
Last edited by a moderator:
I am using ASGOODASITGETS indicator all the time and it made my decisions easier to make but it is a lot of work to check stocks one at a time. I tried to make a scan for it but it did not work. Has someone here try to create a scan for it?
 
That's why I limit the stock(s) I trade. I basically trade the SPY and QQQ. I have a friend who has only traded AAPL for years. When I stray from the SPY & QQQs it is fun to pick a stock and trade the ORB (Opening Range Breakout) as the highs/lows are pretty well established in the first 15-30 minutes. Stocks like AVGO, MSFT, NVDA, etc have good volatility and wide ATR to make ORB trades work well. After the first hour I go back to my SPY for the day.
 
Yes - I use multiple trend direction indicators and am happy when there is a cluster of them showing trend direction change!
 
csricksdds

I am trying to get an alert when the Arrow appears. I want to end the action when the arrow appears and start a new action when the Short/Long Bubble appears. The Short/Long Bubble alerts work. I have tried the following and no alert sounds or appears on my Arrow alert attempts:

alert(usealerts and HighPoint == 1, "-----Arrow Up", alert.bar, sound.ring);
alert(usealerts and LowPoint == 1, "-----Arrow Down", alert.bar, sound.ring);

alert(usealerts and BuyCriteria == 1, "-----Arrow Up", alert.bar, sound.ring);
alert(usealerts and SellCriteria == 1, "-----Arrow Down", alert.bar, sound.ring);

There are no notices by thinkorswim that I have miscoded.

Do you have any suggestions?

Thanks
 
Since I use multiple trend indicators and don't want alerts going all the time I limit my alerts to AsGoodAsItGets as that is my main direction. I have also taken the arrows off my AsGoodAsIt indicator so arrows on it don't interfere with the other indicator arrows I use.

Here is my code without the AGAIG arrows:

# AsGoodAsItGets Indicator without Arrows
#CSR Buy/Sell Arrows with Short/Long Bubbles
#Developed 4-9-22 First Edition 8-23-22 Revised
#No Arrow Edition 1/1/23

declare upper;

input atrreversal = 2.0;

def priceh = MovingAverage(AverageType.EXPONENTIAL, high, 5);
def pricel = MovingAverage(AverageType.EXPONENTIAL, low, 5);

def EIL = ZigZagHighLow("price h" = priceh, "price l" = pricel, "percentage reversal" = .01, "absolute reversal" = .05, "atr length" = 5, "atr reversal" = atrreversal).lastL;
def EIH = ZigZagHighLow("price h" = priceh, "price l" = pricel, "percentage reversal" = .01, "absolute reversal" = .05, "atr length" = 5, "atr reversal" = atrreversal).lastH;

plot signaldown = !isNAN(EIH);

AddChartBubble(SignalDown, high+.15, "Short", Color.white, yes);

plot signalrevBot = !isNaN(EIL);

AddChartBubble(Signalrevbot, low-.15, "Long", Color.white
, no);

input usealerts = yes;
alert(usealerts and signaldown[1] == 1, "Short", alert.bar, sound.ring);
alert(usealerts and signalrevbot[1] == 1, "Long", alert.bar, sound.ring);
thanks I go by the labels, just use the ARROWS as possible buy or sell coming up.
 
Just wanted to say thanks for sharing your indicators. I've been playing around w your indicators over the past few days. It works well w the other indicators I use (mostly volume/Rel Vol based i have adopted and modified over the years. I learned VPA/Wyckoff from the beginning and the concept works well for me). Like you, i only scalp/day trade a few instruments - leveraged bull/bear "pairs" - NUGT/DUST, SOXL/SOXS, LABU/LABD and GUSH/DRIP. largely uncorrelated, volatile enough, decent liquidity plus i've learned and captured data on their "behaviors" over time and unless they all are getting squeezed, i can go long either side of the ETF pair coin. It's like dating 4 girlfriends instead of constant scanning the universe for a new one every day :)
 
Just wanted to say thanks for sharing your indicators. I've been playing around w your indicators over the past few days. It works well w the other indicators I use (mostly volume/Rel Vol based i have adopted and modified over the years. I learned VPA/Wyckoff from the beginning and the concept works well for me). Like you, i only scalp/day trade a few instruments - leveraged bull/bear "pairs" - NUGT/DUST, SOXL/SOXS, LABU/LABD and GUSH/DRIP. largely uncorrelated, volatile enough, decent liquidity plus i've learned and captured data on their "behaviors" over time and unless they all are getting squeezed, i can go long either side of the ETF pair coin. It's like dating 4 girlfriends instead of constant scanning the universe for a new one every day :)
I'm glad they are working for you...give the 4 girls my regards!
 
mod note: This is a repainting indicator:
https://usethinkscript.com/threads/answers-to-commonly-asked-questions.6006/#post-57833

17210[/ATTACH]']
qEauH4J.png

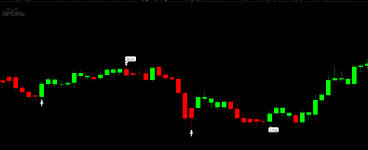
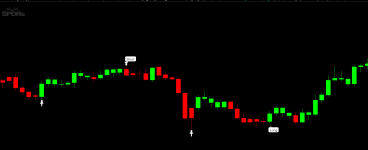
This is what my chart looks like. These are the Indicators: The pivot points and arrows are offset so if they line up means probable trend reversal - if they line up with the short/long is probable trend bingo?

AsGood_HighLow_TurningPointArrows:
Ruby:
##AsGood_HighLowPointPivot_Arrows
def bn = BarNumber();
def na = double.nan;

input length = 7;
def lastBar = HighestAll(if IsNaN(close) then 0 else bn);
def offset = Min(length - 1, lastBar - bn);

input ignore_last_bar = yes;
def ignorelast = if (ignore_last_bar and bn == lastbar) then 0 else 1;

def HighPoint = ignorelast and high > highest(high[1], length - 1) and high == GetValue(highest(high, length), -offset);
def Lowpoint = ignorelast and low < Lowest(low[1], length - 1) and low == GetValue(Lowest(low, length), -offset);


input show_Arrows_on_Highpoints_Lowpoints = yes;
def vert = 0.001;

def prange = highPoint – lowPoint;
def plotHighest = highpoint + prange * .3;
def plotLowest = lowpoint - prange * 3.0;

plot BuyCriteria = if LowPoint then Low else double.NaN ;
plot SellCriteria = if HighPoint then High else double.NaN ;

BuyCriteria.SetPaintingStrategy(PaintingStrategy.ARROW_UP) ;
BuyCriteria.SetDefaultColor(color.WHITE);
BuyCriteria.SetLineWeight(5);
SellCriteria.SetPaintingStrategy(PaintingStrategy.ARROW_DOWN) ;
SellCriteria.SetDefaultColor(color.WHITE);
SellCriteria.SetLineWeight(5);

AGood_TopsBottoms
# Tops \ Bottoms
# Mobius modified
# Modified C.Ricks 12/22/22

input Percent_A_to_C = .1;
input nP = 13;


def AC = Percent_A_to_C / 100;
def h = high;
def l = low;
def bar = BarNumber();
def Ps = 1 + AC;
def Ns = 1 - AC;

def hh = fold j = 1 to nP + 1
with q = 1
while q
do h > GetValue(h, -j);

def PivotH = if (bar > nP and
h == Highest(h, nP) and
hh)
then h
else Double.NaN;

def PH1 = if !isNaN(PivotH)
then h
else PH1[1];

def PH2 = if PH1 != PH1[1]
then PH1[1]
else PH2[1];

def CheckH1 = if between(PH2, PH1 * Ns, PH1 * Ps)
then 1
else 0;

plot PivotHDot = PivotH;
PivotHDot.SetDefaultColor(Color.WHITE);
PivotHDot.SetPaintingStrategy(PaintingStrategy.POINTS);


# Double Bottom

def ll = fold jl = 1 to nP + 1
with ql = 1
while ql
do l < GetValue(low, -jl);

def PivotL = if (bar > nP and
l == Lowest(l, nP) and
ll)
then l
else Double.NaN;

def PL1 = if !isNaN(PivotL)
then l
else PL1[1];

def PL2 = if PL1 != PL1[1]
then PL1[1]
else PL2[1];

def Check1 = if between(PL2, PL1 * Ns, PL1 * Ps)
then 1
else 0;


plot PivotLDot = PivotL;
PivotLDot.SetDefaultColor(Color.White);
PivotLDot.SetPaintingStrategy(PaintingStrategy.POINTS);

# End Code


AsGoodAsItGets_NoArrows (this is with no arrows so as not to compete with above indicators)

# AsGoodAsItGets Indicator without Arrows
#CSR Buy/Sell Arrows with Short/Long Bubbles
#Developed 4-9-22 First Edition 8-23-22 Revised
#No Arrow Edition 1/1/23

declare upper;

input atrreversal = 2.0;

def priceh = MovingAverage(AverageType.EXPONENTIAL, high, 5);
def pricel = MovingAverage(AverageType.EXPONENTIAL, low, 5);

def EIL = ZigZagHighLow("price h" = priceh, "price l" = pricel, "percentage reversal" = .01, "absolute reversal" = .05, "atr length" = 5, "atr reversal" = atrreversal).lastL;
def EIH = ZigZagHighLow("price h" = priceh, "price l" = pricel, "percentage reversal" = .01, "absolute reversal" = .05, "atr length" = 5, "atr reversal" = atrreversal).lastH;

plot signaldown = !isNAN(EIH);

AddChartBubble(SignalDown, high+.05, "Short", Color.white, yes);

plot signalrevBot = !isNaN(EIL);

AddChartBubble(Signalrevbot, low-.08, "Long", Color.white
, no);

input usealerts = yes;
alert(usealerts and signaldown[1] == 1, "Short", alert.bar, sound.ring);
alert(usealerts and signalrevbot[1] == 1, "Long", alert.bar, sound.ring);

AsGoodTrendColorCandles_MTFs
###This ASGoodTrendColorCandles_MTFs Indicator looks back 6 periods on each time frame divided by .5 painting the candle trend Green or Red. I use this as continued verification for my AsGoodAsItGets Long/Short Buy/Sell Indicator since it might repaint and I'm looking for further trend verification.
###Inspiration for this from the TTM_Trend Indicator which is a free indicator on TOS but doesn't provide code.
###Charles Ricks v.1 10/31/22 This indicator automatically address most time frames.

input AGP0 = AggregationPeriod.Min;
input AGP = AggregationPeriod.Five_Min;
input AGP1 = AggregationPeriod.Fifteen_Min;
input AGP2 = AggregationPeriod.Thirty_Min;
input AGP3 = AggregationPeriod.Hour;
input AGP4H = AggregationPeriod.FOUR_Hours;
input AGP4 = AggregationPeriod.DAY;
input AGP5 = AggregationPeriod.Week;
input AGP6 = AggregationPeriod.Month;
input TrendPeriods = 6;

def OP = open(period = AGP);
def HI = high(period = AGP);
def LOW = low(period = AGP);
def Close = close(period = AGP);
def HighestHigh = highest(HI, trendPeriods);
def LowestLow = lowest(LOW, trendPeriods);
def CandleTrend = if ((Close - LowestLow) / (HighestHigh - LowestLow)) > .5
then 1
else 0;

AssignPriceColor(if CandleTrend then color.green else color.red);
def OP0 = open(period = AGP0);
def HI0 = high(period = AGP0);
def LOW0 = low(period = AGP0);
def Close0 = close(period = AGP0);
def HighestHigh0 = highest(HI, trendPeriods);
def LowestLow0 = lowest(LOW, trendPeriods);
def trend0 = if ((Close - LowestLow) / (HighestHigh - LowestLow)) > .5
then 1
else 0;

AssignPriceColor(if CandleTrend then color.green else color.red);
def OP1 = open(period = AGP1);
def HI1 = high(period = AGP1);
def LOW1 = low(period = AGP1);
def Close1 = close(period = AGP1);
def HighestHigh1 = highest(HI, trendPeriods);
def LowestLow1 = lowest(LOW, trendPeriods);
def trend1 = if ((Close - LowestLow) / (HighestHigh - LowestLow)) > .5
then 1
else 0;

AssignPriceColor(if CandleTrend then color.green else color.red);
def OP2 = open(period = AGP2);
def HI2 = high(period = AGP2);
def LOW2 = low(period = AGP2);
def Close2 = close(period = AGP2);
def HighestHigh2 = highest(HI, trendPeriods);
def LowestLow2 = lowest(LOW, trendPeriods);
def trend2 = if ((Close - LowestLow) / (HighestHigh - LowestLow)) > .5
then 1
else 0;

AssignPriceColor(if CandleTrend then color.green else color.red);
def OP3 = open(period = AGP3);
def HI3 = high(period = AGP3);
def LOW3 = low(period = AGP3);
def Close3 = close(period = AGP3);
def HighestHigh3 = highest(HI, trendPeriods);
def LowestLow3 = lowest(LOW, trendPeriods);
def trend3 = if ((Close - LowestLow) / (HighestHigh - LowestLow)) > .5
then 1
else 0;

AssignPriceColor(if CandleTrend then color.green else color.red);
def OP4 = open(period = AGP4);
def HI4 = high(period = AGP4);
def LOW4 = low(period = AGP4);
def Close4 = close(period = AGP4);
def HighestHigh4 = highest(HI, trendPeriods);
def LowestLow4 = lowest(LOW, trendPeriods);
def trend4 = if ((Close - LowestLow) / (HighestHigh - LowestLow)) > .5
then 1
else 0;

AssignPriceColor(if CandleTrend then color.green else color.red);
def OP4H = open(period = AGP4H);
def HI4H = high(period = AGP4H);
def LOW4H = low(period = AGP4H);
def Close4H = close(period = AGP4H);
def HighestHigh4H = highest(HI, trendPeriods);
def LowestLow4H = lowest(LOW, trendPeriods);
def trend4H = if ((Close - LowestLow) / (HighestHigh - LowestLow)) > .5
then 1
else 0;

AssignPriceColor(if CandleTrend then color.green else color.red);
def OP5 = open(period = AGP5);
def HI5 = high(period = AGP5);
def LOW5 = low(period = AGP5);
def Close5 = close(period = AGP5);
def HighestHigh5 = highest(HI, trendPeriods);
def LowestLow5 = lowest(LOW, trendPeriods);
def trend5 = if ((Close - LowestLow) / (HighestHigh - LowestLow)) > .5
then 1
else 0;

AssignPriceColor(if CandleTrend then color.green else color.red);
def OP6 = open(period = AGP6);
def HI6 = high(period = AGP6);
def LOW6 = low(period = AGP6);
def Close6 = close(period = AGP6);
def HighestHigh6 = highest(HI, trendPeriods);
def LowestLow6 = lowest(LOW, trendPeriods);
def trend6 = if ((Close - LowestLow) / (HighestHigh - LowestLow)) > .5
then 1
else 0;

AssignPriceColor(if CandleTrend then color.green else color.red);

###End
Hello. Can you code" AsGood_HighLowPointPivot_Arrows" for the TOS script scanner. When the arrow pops up i get the alert.
 

Attachments

  • qEauH4J.png
    qEauH4J.png
    16 KB · Views: 276
mod note: This is a repainting indicator:
https://usethinkscript.com/threads/answers-to-commonly-asked-questions.6006/#post-57833

17212[/ATTACH]']
qEauH4J.png

This is what my chart looks like. These are the Indicators: The pivot points and arrows are offset so if they line up means probable trend reversal - if they line up with the short/long is probable trend bingo?

AsGood_HighLow_TurningPointArrows:
Ruby:
##AsGood_HighLowPointPivot_Arrows
def bn = BarNumber();
def na = double.nan;

input length = 7;
def lastBar = HighestAll(if IsNaN(close) then 0 else bn);
def offset = Min(length - 1, lastBar - bn);

input ignore_last_bar = yes;
def ignorelast = if (ignore_last_bar and bn == lastbar) then 0 else 1;

def HighPoint = ignorelast and high > highest(high[1], length - 1) and high == GetValue(highest(high, length), -offset);
def Lowpoint = ignorelast and low < Lowest(low[1], length - 1) and low == GetValue(Lowest(low, length), -offset);


input show_Arrows_on_Highpoints_Lowpoints = yes;
def vert = 0.001;

def prange = highPoint – lowPoint;
def plotHighest = highpoint + prange * .3;
def plotLowest = lowpoint - prange * 3.0;

plot BuyCriteria = if LowPoint then Low else double.NaN ;
plot SellCriteria = if HighPoint then High else double.NaN ;

BuyCriteria.SetPaintingStrategy(PaintingStrategy.ARROW_UP) ;
BuyCriteria.SetDefaultColor(color.WHITE);
BuyCriteria.SetLineWeight(5);
SellCriteria.SetPaintingStrategy(PaintingStrategy.ARROW_DOWN) ;
SellCriteria.SetDefaultColor(color.WHITE);
SellCriteria.SetLineWeight(5);

AGood_TopsBottoms
# Tops \ Bottoms
# Mobius modified
# Modified C.Ricks 12/22/22

input Percent_A_to_C = .1;
input nP = 13;


def AC = Percent_A_to_C / 100;
def h = high;
def l = low;
def bar = BarNumber();
def Ps = 1 + AC;
def Ns = 1 - AC;

def hh = fold j = 1 to nP + 1
with q = 1
while q
do h > GetValue(h, -j);

def PivotH = if (bar > nP and
h == Highest(h, nP) and
hh)
then h
else Double.NaN;

def PH1 = if !isNaN(PivotH)
then h
else PH1[1];

def PH2 = if PH1 != PH1[1]
then PH1[1]
else PH2[1];

def CheckH1 = if between(PH2, PH1 * Ns, PH1 * Ps)
then 1
else 0;

plot PivotHDot = PivotH;
PivotHDot.SetDefaultColor(Color.WHITE);
PivotHDot.SetPaintingStrategy(PaintingStrategy.POINTS);


# Double Bottom

def ll = fold jl = 1 to nP + 1
with ql = 1
while ql
do l < GetValue(low, -jl);

def PivotL = if (bar > nP and
l == Lowest(l, nP) and
ll)
then l
else Double.NaN;

def PL1 = if !isNaN(PivotL)
then l
else PL1[1];

def PL2 = if PL1 != PL1[1]
then PL1[1]
else PL2[1];

def Check1 = if between(PL2, PL1 * Ns, PL1 * Ps)
then 1
else 0;


plot PivotLDot = PivotL;
PivotLDot.SetDefaultColor(Color.White);
PivotLDot.SetPaintingStrategy(PaintingStrategy.POINTS);

# End Code


AsGoodAsItGets_NoArrows (this is with no arrows so as not to compete with above indicators)

# AsGoodAsItGets Indicator without Arrows
#CSR Buy/Sell Arrows with Short/Long Bubbles
#Developed 4-9-22 First Edition 8-23-22 Revised
#No Arrow Edition 1/1/23

declare upper;

input atrreversal = 2.0;

def priceh = MovingAverage(AverageType.EXPONENTIAL, high, 5);
def pricel = MovingAverage(AverageType.EXPONENTIAL, low, 5);

def EIL = ZigZagHighLow("price h" = priceh, "price l" = pricel, "percentage reversal" = .01, "absolute reversal" = .05, "atr length" = 5, "atr reversal" = atrreversal).lastL;
def EIH = ZigZagHighLow("price h" = priceh, "price l" = pricel, "percentage reversal" = .01, "absolute reversal" = .05, "atr length" = 5, "atr reversal" = atrreversal).lastH;

plot signaldown = !isNAN(EIH);

AddChartBubble(SignalDown, high+.05, "Short", Color.white, yes);

plot signalrevBot = !isNaN(EIL);

AddChartBubble(Signalrevbot, low-.08, "Long", Color.white
, no);

input usealerts = yes;
alert(usealerts and signaldown[1] == 1, "Short", alert.bar, sound.ring);
alert(usealerts and signalrevbot[1] == 1, "Long", alert.bar, sound.ring);

AsGoodTrendColorCandles_MTFs
###This ASGoodTrendColorCandles_MTFs Indicator looks back 6 periods on each time frame divided by .5 painting the candle trend Green or Red. I use this as continued verification for my AsGoodAsItGets Long/Short Buy/Sell Indicator since it might repaint and I'm looking for further trend verification.
###Inspiration for this from the TTM_Trend Indicator which is a free indicator on TOS but doesn't provide code.
###Charles Ricks v.1 10/31/22 This indicator automatically address most time frames.

input AGP0 = AggregationPeriod.Min;
input AGP = AggregationPeriod.Five_Min;
input AGP1 = AggregationPeriod.Fifteen_Min;
input AGP2 = AggregationPeriod.Thirty_Min;
input AGP3 = AggregationPeriod.Hour;
input AGP4H = AggregationPeriod.FOUR_Hours;
input AGP4 = AggregationPeriod.DAY;
input AGP5 = AggregationPeriod.Week;
input AGP6 = AggregationPeriod.Month;
input TrendPeriods = 6;

def OP = open(period = AGP);
def HI = high(period = AGP);
def LOW = low(period = AGP);
def Close = close(period = AGP);
def HighestHigh = highest(HI, trendPeriods);
def LowestLow = lowest(LOW, trendPeriods);
def CandleTrend = if ((Close - LowestLow) / (HighestHigh - LowestLow)) > .5
then 1
else 0;

AssignPriceColor(if CandleTrend then color.green else color.red);
def OP0 = open(period = AGP0);
def HI0 = high(period = AGP0);
def LOW0 = low(period = AGP0);
def Close0 = close(period = AGP0);
def HighestHigh0 = highest(HI, trendPeriods);
def LowestLow0 = lowest(LOW, trendPeriods);
def trend0 = if ((Close - LowestLow) / (HighestHigh - LowestLow)) > .5
then 1
else 0;

AssignPriceColor(if CandleTrend then color.green else color.red);
def OP1 = open(period = AGP1);
def HI1 = high(period = AGP1);
def LOW1 = low(period = AGP1);
def Close1 = close(period = AGP1);
def HighestHigh1 = highest(HI, trendPeriods);
def LowestLow1 = lowest(LOW, trendPeriods);
def trend1 = if ((Close - LowestLow) / (HighestHigh - LowestLow)) > .5
then 1
else 0;

AssignPriceColor(if CandleTrend then color.green else color.red);
def OP2 = open(period = AGP2);
def HI2 = high(period = AGP2);
def LOW2 = low(period = AGP2);
def Close2 = close(period = AGP2);
def HighestHigh2 = highest(HI, trendPeriods);
def LowestLow2 = lowest(LOW, trendPeriods);
def trend2 = if ((Close - LowestLow) / (HighestHigh - LowestLow)) > .5
then 1
else 0;

AssignPriceColor(if CandleTrend then color.green else color.red);
def OP3 = open(period = AGP3);
def HI3 = high(period = AGP3);
def LOW3 = low(period = AGP3);
def Close3 = close(period = AGP3);
def HighestHigh3 = highest(HI, trendPeriods);
def LowestLow3 = lowest(LOW, trendPeriods);
def trend3 = if ((Close - LowestLow) / (HighestHigh - LowestLow)) > .5
then 1
else 0;

AssignPriceColor(if CandleTrend then color.green else color.red);
def OP4 = open(period = AGP4);
def HI4 = high(period = AGP4);
def LOW4 = low(period = AGP4);
def Close4 = close(period = AGP4);
def HighestHigh4 = highest(HI, trendPeriods);
def LowestLow4 = lowest(LOW, trendPeriods);
def trend4 = if ((Close - LowestLow) / (HighestHigh - LowestLow)) > .5
then 1
else 0;

AssignPriceColor(if CandleTrend then color.green else color.red);
def OP4H = open(period = AGP4H);
def HI4H = high(period = AGP4H);
def LOW4H = low(period = AGP4H);
def Close4H = close(period = AGP4H);
def HighestHigh4H = highest(HI, trendPeriods);
def LowestLow4H = lowest(LOW, trendPeriods);
def trend4H = if ((Close - LowestLow) / (HighestHigh - LowestLow)) > .5
then 1
else 0;

AssignPriceColor(if CandleTrend then color.green else color.red);
def OP5 = open(period = AGP5);
def HI5 = high(period = AGP5);
def LOW5 = low(period = AGP5);
def Close5 = close(period = AGP5);
def HighestHigh5 = highest(HI, trendPeriods);
def LowestLow5 = lowest(LOW, trendPeriods);
def trend5 = if ((Close - LowestLow) / (HighestHigh - LowestLow)) > .5
then 1
else 0;

AssignPriceColor(if CandleTrend then color.green else color.red);
def OP6 = open(period = AGP6);
def HI6 = high(period = AGP6);
def LOW6 = low(period = AGP6);
def Close6 = close(period = AGP6);
def HighestHigh6 = highest(HI, trendPeriods);
def LowestLow6 = lowest(LOW, trendPeriods);
def trend6 = if ((Close - LowestLow) / (HighestHigh - LowestLow)) > .5
then 1
else 0;

AssignPriceColor(if CandleTrend then color.green else color.red);

###End
Hello, can you create a study for TOS to scan

As_Good_HighLow_TurningPointArrows
 

Attachments

  • qEauH4J.png
    qEauH4J.png
    16 KB · Views: 237
It is not recommended that one scans repainting candles as it is not accurate. This is why I stick with only one or two, high volatility, close bid ask stocks (ETFs) and use multiple trend indicators to hopefully determine correct direction for my day trade.
 
@csricksdds I have been using this indicator for swing trading along with Darvis Box, 2 EMA's and 2 lower studies they work great overall. I would like to see the indicator also include code to display supply and demand areas on the candle it fires on and allows the user to control the number of areas shown and the appearance of the supply and demand areas using input parameters but to some degree Darvis Box gives some of this information, overall I just wanted to say thanks for a good trading tool.
 
@csricksdds I have been using this indicator for swing trading along with Darvis Box, 2 EMA's and 2 lower studies they work great overall. I would like to see the indicator also include code to display supply and demand areas on the candle it fires on and allows the user to control the number of areas shown and the appearance of the supply and demand areas using input parameters but to some degree Darvis Box gives some of this information, overall I just wanted to say thanks for a good trading tool.
You're welcome and I'm glad you like the indicator....I only do day trading with it and am too old to be a swinger anymore ):
 
When I put the code in I get an Invalid Statement for Lines 33, 110, and 140 basically each of the Headers.

Any suggestion?
Since you sent no picture I'm not sure...but if headers and not part of indicator place a # before each one and see if it clears things up??
 

Join useThinkScript to post your question to a community of 21,000+ developers and traders.

Not the exact question you're looking for?

Start a new thread and receive assistance from our community.

87k+ Posts
262 Online
Create Post

The Market Trading Game Changer

Join 2,500+ subscribers inside the useThinkScript VIP Membership Club
  • Exclusive indicators
  • Proven strategies & setups
  • Private Discord community
  • ‘Buy The Dip’ signal alerts
  • Exclusive members-only content
  • Add-ons and resources
  • 1 full year of unlimited support

Frequently Asked Questions

What is useThinkScript?

useThinkScript is the #1 community of stock market investors using indicators and other tools to power their trading strategies. Traders of all skill levels use our forums to learn about scripting and indicators, help each other, and discover new ways to gain an edge in the markets.

How do I get started?

We get it. Our forum can be intimidating, if not overwhelming. With thousands of topics, tens of thousands of posts, our community has created an incredibly deep knowledge base for stock traders. No one can ever exhaust every resource provided on our site.

If you are new, or just looking for guidance, here are some helpful links to get you started.

What are the benefits of VIP Membership?
VIP members get exclusive access to these proven and tested premium indicators: Buy the Dip, Advanced Market Moves 2.0, Take Profit, and Volatility Trading Range. In addition, VIP members get access to over 50 VIP-only custom indicators, add-ons, and strategies, private VIP-only forums, private Discord channel to discuss trades and strategies in real-time, customer support, trade alerts, and much more. Learn all about VIP membership here.
How can I access the premium indicators?
To access the premium indicators, which are plug and play ready, sign up for VIP membership here.
Back
Top