

AGAIG Combined Alignment Oscillator
What this oscillator shows. Two separate lower studies, three inputs (trend slope, MTF Laguerre RSI, current-TF Laguerre RSI) but two different decision rules on top of them — a discrete 2-of-3 vote with conviction height, and a continuous gradient with no vote at all. Loading both together is genuinely useful: the discrete one gives you a clean go/no-go read, the gradient shows you the texture underneath that read, and disagreements between the two are informative on their own (a gradient reading strongly bullish while the discrete label says CHOP means you're right at a vote boundary).
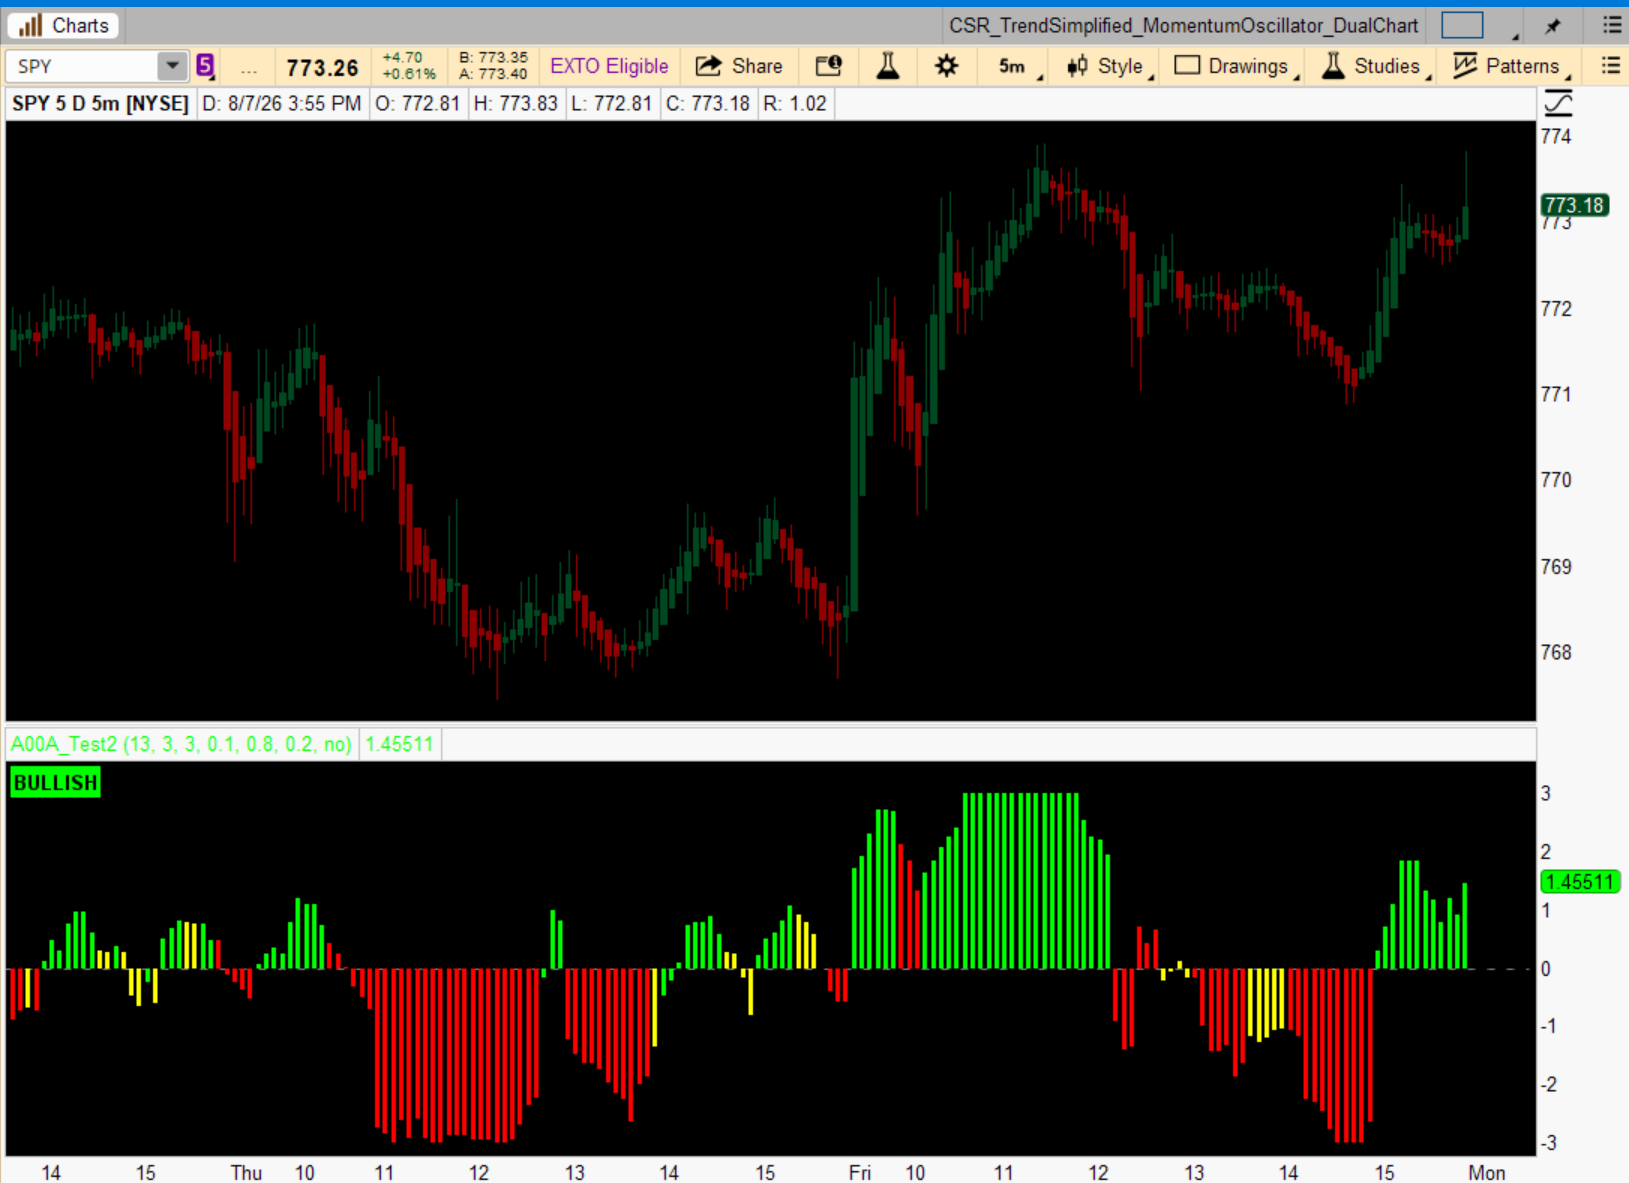
The label is a convenience, not new information. Both labels restate what the color already tells you — they just make it readable without staring at hue or height. That's fine for a dashboard but worth remembering neither adds a signal you didn't already have.
This is not three independent opinions. The two Laguerre RSI reads share the same underlying formula at different timeframes, so they'll frequently agree with each other by construction, not by genuine confirmation. The trend slope is the one component actually looking at something different (a Chande-style EMA trend line vs. RSI-style momentum).
Everything here is a lagging confirmation tool. EMA smoothing plus Laguerre filtering means both versions describe where the market has been agreeing, not where it's about to turn. Good for filtering trade direction or grading a setup after the fact; not built to call entries.
Oscillator Link: http://tos.mx/!Rd7VNJqe
Code:
declare lower;

input nFE               = 13;    # Laguerre / Fractal-Energy length
input trendMultiplier   = 3;     # higher-TF multiplier for the Trend script
input momentumMultiplier = 3;    # higher-TF multiplier for the MTF momentum script
input slopeThreshold    = 0.1;   # trend slope threshold (in ticks)
input rsiOverbought     = 0.8;
input rsiOversold       = 0.2;
input requireUnanimous  = no;    # yes = 3-of-3 to color, no = 2-of-3 majority

# ---------------------------------------------------------------
# Script 1: Longer-Term Trend (Chande-style trend line + slope)
# ---------------------------------------------------------------
script Trend {
    input multiplier = 3;
    def _aDxPeriod  = 5.0;
    def _chandeEMA  = _aDxPeriod;
    def _weightDi   = _aDxPeriod;
    def _weightDm   = _aDxPeriod;
    def _weightDx   = _aDxPeriod;

    def _pdm = CompoundValue(1,
        ((_weightDm - 1.0) * _pdm[1] +
         Max(close(period = GetAggregationPeriod() * multiplier) -
             close(period = GetAggregationPeriod() * multiplier)[1], 0)) / _weightDm, 0);
    def _mdm = CompoundValue(1,
        ((_weightDm - 1.0) * _mdm[1] +
         Max(close(period = GetAggregationPeriod() * multiplier)[1] -
             close(period = GetAggregationPeriod() * multiplier), 0)) / _weightDm, 0);

    def num  = _pdm + _mdm;
    def _pdi = if num > 0.0 then ((_weightDi - 1.0) * _pdi[1] + _pdm / num) / _weightDi
               else (_weightDi - 1.0) * _pdi[1] / _weightDi;
    def _mdi = if num > 0.0 then ((_weightDi - 1.0) * _mdi[1] + _mdm / num) / _weightDi
               else (_weightDi - 1.0) * _mdi[1] / _weightDi;

    def num2 = AbsValue(_pdi - _mdi);
    def num3 = Round(_pdi + _mdi);
    def _out = if num3 > 0.0 then ((_weightDx - 1.0) * _out[1] + num2 / num3) / _weightDx
               else (_weightDx - 1.0) * _out[1] / _weightDx;

    def mx = Max(_out, _out[1]);
    def mn = Min(_out, _out[1]);
    def _hhv = fold i = 1 to _aDxPeriod
               do if GetValue(_out, i + 1, _aDxPeriod) > mx then GetValue(_out, i + 1, _aDxPeriod) else mx;
    def _llv = fold j = 1 to _aDxPeriod
               do if GetValue(_out, j + 1, _aDxPeriod) < mn then GetValue(_out, j + 1, _aDxPeriod) else mn;

    def num5 = _hhv - _llv;
    def num6 = if num5 > 0.0 then (_out - _llv) / num5 else 0;
    def _main = (((_chandeEMA - num6) * _main[1]) +
                 (num6 * close(period = GetAggregationPeriod() * multiplier))) / _chandeEMA;

    plot RLTrendLine = _main;
    plot Slope = ((RLTrendLine - RLTrendLine[1]) / 2) / TickSize();
}

# ---------------------------------------------------------------
# Script 2: Laguerre RSI (works on ANY timeframe via multiplier)
#   multiplier = 1  -> current timeframe
#   multiplier > 1  -> higher timeframe
# ---------------------------------------------------------------
script LaguerreRSI {
    input nFE = 13;
    input multiplier = 1;

    def o = (open(period = GetAggregationPeriod() * multiplier) +
             close(period = GetAggregationPeriod() * multiplier)[1]) / 2;
    def h = Max(high(period = GetAggregationPeriod() * multiplier),
                close(period = GetAggregationPeriod() * multiplier)[1]);
    def l = Min(low(period = GetAggregationPeriod() * multiplier),
                close(period = GetAggregationPeriod() * multiplier)[1]);
    def c = (o + h + l + close(period = GetAggregationPeriod() * multiplier)) / 4;

    def gamma = Log(Sum((Max(high(period = GetAggregationPeriod() * multiplier),
                              close(period = GetAggregationPeriod() * multiplier)[1]) -
                          Min(low(period = GetAggregationPeriod() * multiplier),
                              close(period = GetAggregationPeriod() * multiplier)[1])), nFE) /
                (Highest(high(period = GetAggregationPeriod() * multiplier), nFE) -
                 Lowest(low(period = GetAggregationPeriod() * multiplier), nFE)))
                / Log(nFE);

    def L0;
    def L1;
    def L2;
    def L3;
    L0 = (1 - gamma) * c + gamma * L0[1];
    L1 = -gamma * L0 + L0[1] + gamma * L1[1];
    L2 = -gamma * L1 + L1[1] + gamma * L2[1];
    L3 = -gamma * L2 + L2[1] + gamma * L3[1];

    def CU1;
    def CD1;
    if L0 >= L1
    then {
        CU1 = L0 - L1;
        CD1 = 0;
    } else {
        CD1 = L1 - L0;
        CU1 = 0;
    }

    def CU2;
    def CD2;
    if L1 >= L2
    then {
        CU2 = CU1 + L1 - L2;
        CD2 = CD1;
    } else {
        CD2 = CD1 + L2 - L1;
        CU2 = CU1;
    }

    def CU;
    def CD;
    if L2 >= L3
    then {
        CU = CU2 + L2 - L3;
        CD = CD2;
    } else {
        CU = CU2;
        CD = CD2 + L3 - L2;
    }

    plot RSI = if CU + CD <> 0 then CU / (CU + CD) else 0;
}

# ---------------------------------------------------------------
# Reduce each sub-indicator to a -1 / 0 / +1 state
# ---------------------------------------------------------------
def trendSlope = Trend(trendMultiplier).Slope;
def trendState = if trendSlope > slopeThreshold then 1
                 else if trendSlope < -slopeThreshold then -1
                 else 0;

def mtfRSI = LaguerreRSI(nFE, momentumMultiplier).RSI;
def mtfState = if mtfRSI > rsiOverbought then 1
               else if mtfRSI < rsiOversold then -1
               else if mtfRSI > rsiOversold and mtfRSI > mtfRSI[1] then 1
               else -1;

def curRSI = LaguerreRSI(nFE, 1).RSI;
def curState = if curRSI > rsiOverbought then 1
               else if curRSI < rsiOversold then -1
               else if curRSI > rsiOversold and curRSI > curRSI[1] then 1
               else -1;

# ---------------------------------------------------------------
# Alignment vote
# ---------------------------------------------------------------
def bullCount = (if trendState == 1 then 1 else 0) +
                (if mtfState == 1 then 1 else 0) +
                (if curState == 1 then 1 else 0);
def bearCount = (if trendState == -1 then 1 else 0) +
                (if mtfState == -1 then 1 else 0) +
                (if curState == -1 then 1 else 0);

def isGreen = if requireUnanimous then bullCount == 3 else bullCount >= 2;
def isRed   = if requireUnanimous then bearCount == 3 else bearCount >= 2;

# ---------------------------------------------------------------
# Strength / magnitude — how strongly, not just whether
#   trend:    normalized distance past the slope threshold, clipped to +/-1
#   momentum: RSI distance from 0.5 midpoint, doubled -> naturally +/-1
#   total:    sum of the three, roughly +/-3
# ---------------------------------------------------------------
def trendNorm = trendSlope / (slopeThreshold * 5);
def trendStrength = if trendNorm > 1 then 1 else if trendNorm < -1 then -1 else trendNorm;

def mtfStrength = (mtfRSI - 0.5) * 2;
def curStrength = (curRSI - 0.5) * 2;

def totalStrength = trendStrength + mtfStrength + curStrength;

# ---------------------------------------------------------------
# Single combined histogram — height = conviction, color = vote
# ---------------------------------------------------------------
plot Alignment = if IsNaN(close) then Double.NaN else totalStrength;
Alignment.SetPaintingStrategy(PaintingStrategy.HISTOGRAM);
Alignment.SetLineWeight(3);
Alignment.DefineColor("GREEN", Color.GREEN);
Alignment.DefineColor("RED", Color.RED);
Alignment.DefineColor("YELLOW", Color.YELLOW);
Alignment.AssignValueColor(
    if isGreen then Alignment.Color("GREEN")
    else if isRed then Alignment.Color("RED")
    else Alignment.Color("YELLOW")
);

plot ZeroLine = 0;
ZeroLine.SetDefaultColor(Color.GRAY);
ZeroLine.SetStyle(Curve.SHORT_DASH);
ZeroLine.HideBubble();
ZeroLine.HideTitle();

# ---------------------------------------------------------------
# Bullish / Bearish / Chop label
#   Driven by the same isGreen / isRed vote as the bar color,
#   so the label always matches what you see on the histogram.
# ---------------------------------------------------------------
AddLabel(yes,
    if isGreen then "BULLISH"
    else if isRed then "BEARISH"
    else "CHOP",
    if isGreen then Color.GREEN
    else if isRed then Color.RED
    else Color.YELLOW);
Last edited by a moderator:
