I'm trying to add up the values of an indicator when they reach a certain condition to have a total by the end of the day but can't get anything going with sum or compoundvalue. It's doing my head in.
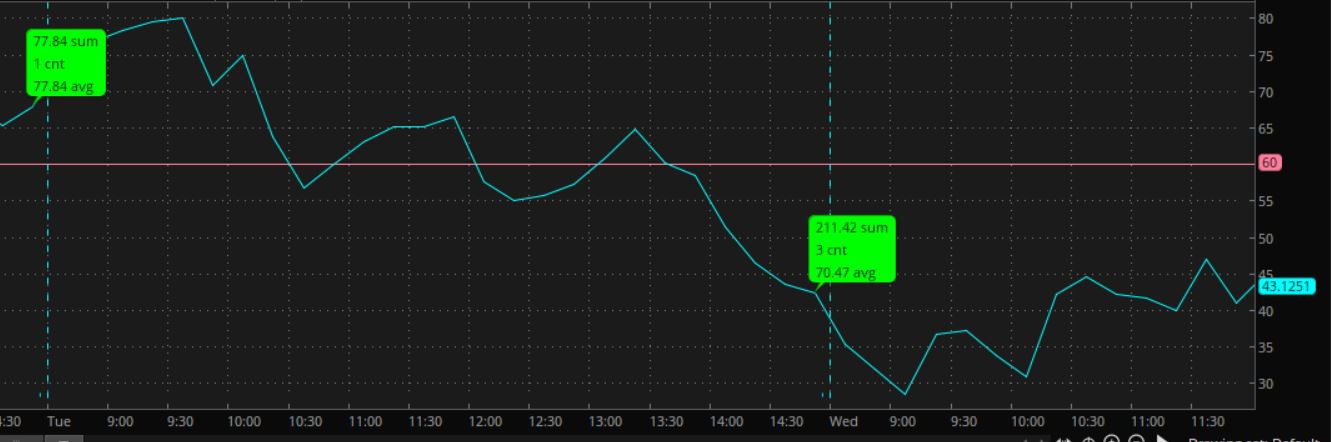
For example, let's say I have an RSI indicator, and I want to add up its peak values only after it crosses below some number like 60. So my indicator would find the highest value between the time it crossed above 60 and crossed below 60. After the market closes, I want to add up all the highest values from the start of the day to the end, that met my condition.
My actual use case is more complicated than this but I'm hoping I can get some clues using this example. Would appreciate any help!