1:51 / 6:57 • Intro TICK Divergences, Extreme TICK Alerts, & Cumulative TICK Indicators -The strategy isn't that complex, but it watches for the strengths and weaknesses of market internals. I found ONE indicator that shows divergence patterns on the $TICK chart (which you have to pay for) from TradeEdge coding for TOS. It gives alerts when the the TICK comes into possible exhaustion periods (when it hits the 600 and 800 levels and extreme levels 1000. It would be great to have someone make this indicator.
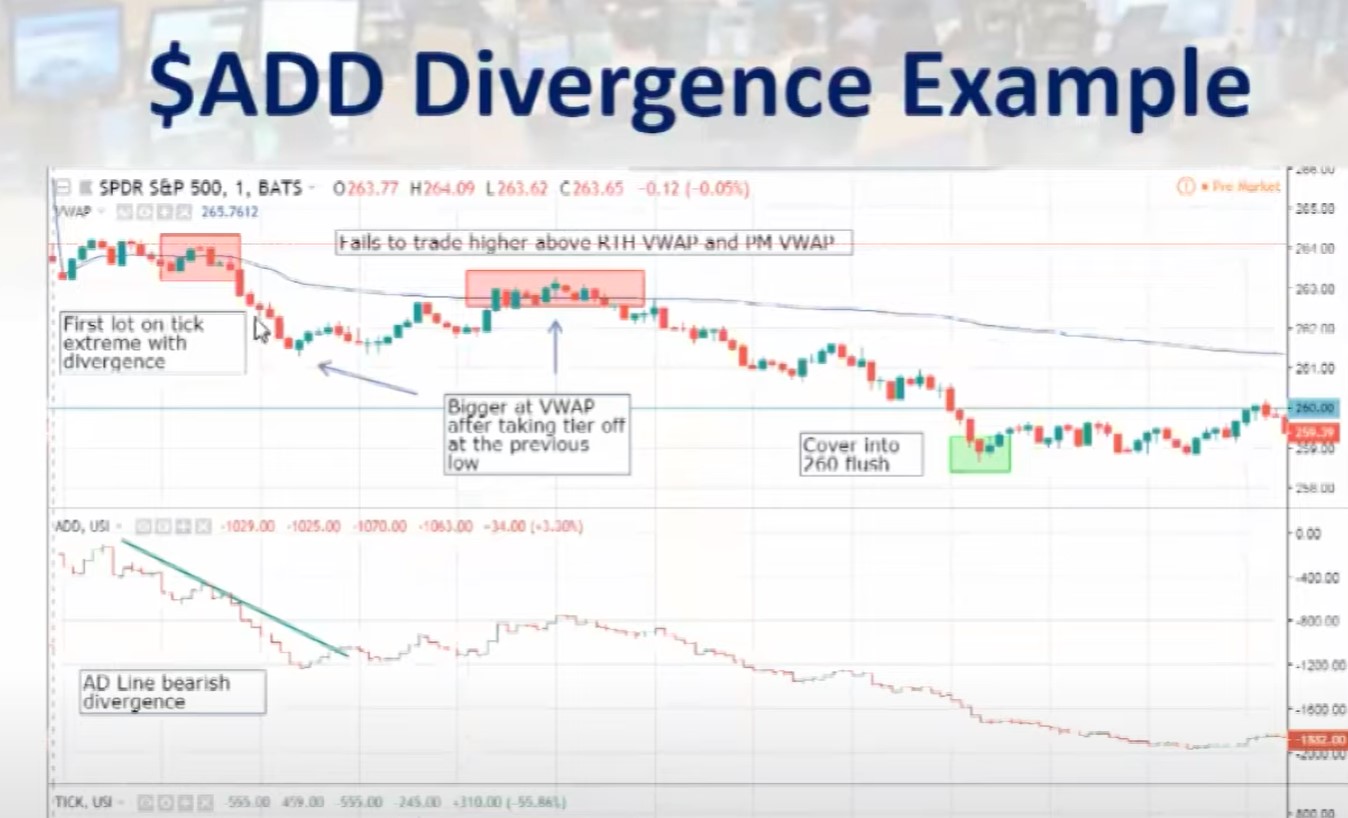
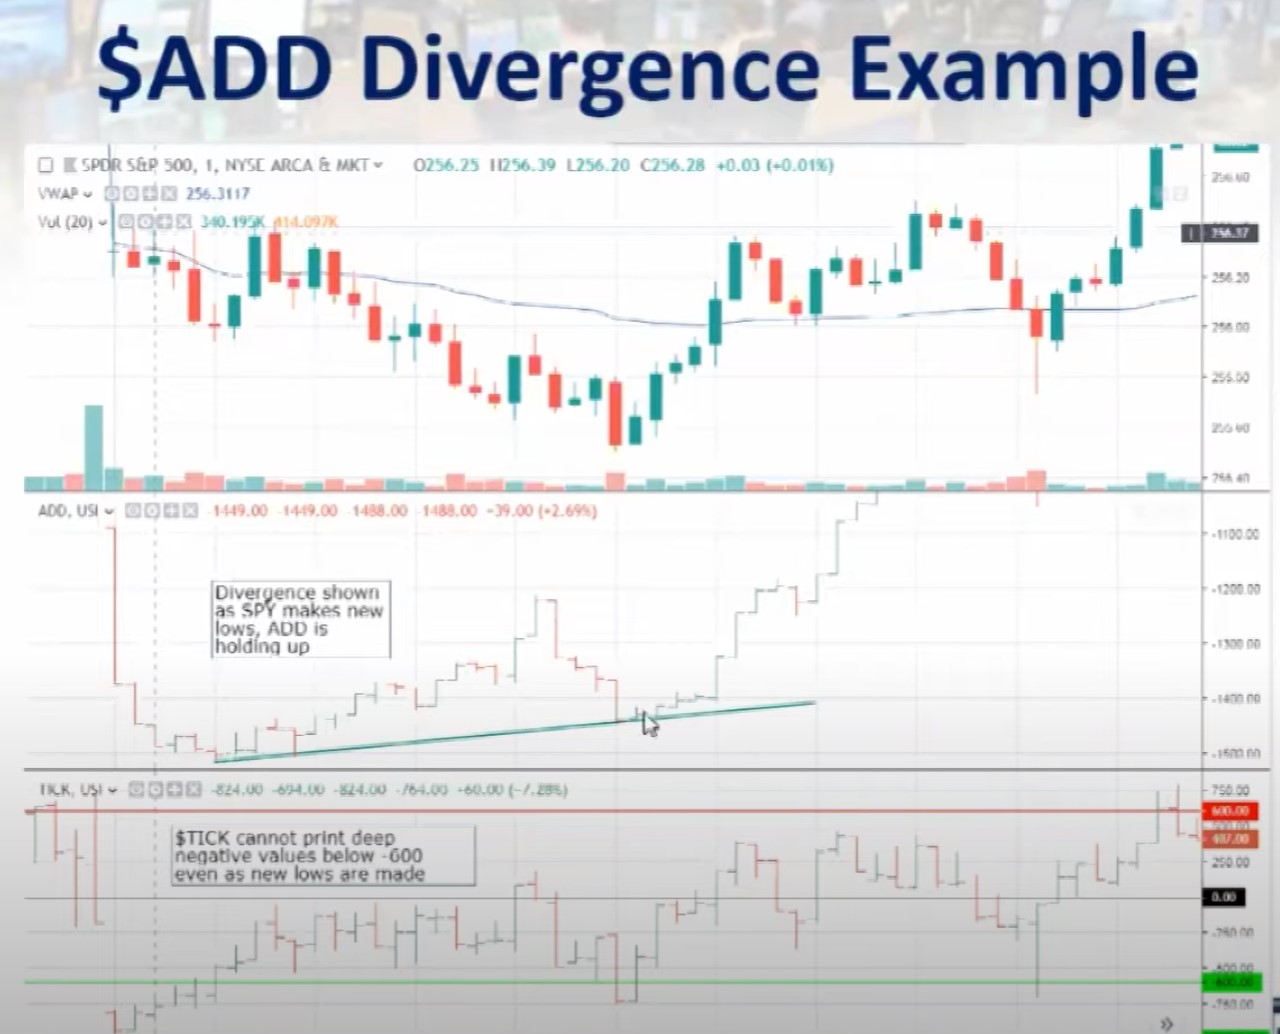
But also a major part of the strategy is the movement of the $ADD. Major levels are at zero and 2000 and -2000 for extremes and the 1500and 1800 levels. I can't find anywhere where there is an indicator finding divergences between the $ADD and the SPY.
Last week for example I saw the ADD tanking as the SPY was going up, and I made a boatload on puts... It would be great to have an indicator that would show divergences on the ADD. @MerryDay ?
Here are examples:


Last edited:
