
Author Message:
The Adaptive Gaussian Moving Average (AGMA) is a versatile technical indicator that combines the concept of a Gaussian Moving Average (GMA) with adaptive parameters based on market volatility. The indicator aims to provide a smoothed trend line that dynamically adjusts to different market conditions, offering a more responsive analysis of price movements.
Calculation:
The AGMA is calculated by applying a weighted moving average based on a Gaussian distribution. The length parameter determines the number of bars considered for the calculation. The adaptive parameter enables or disables the adaptive feature. When adaptive is true, the sigma value, which represents the standard deviation, is dynamically calculated using the standard deviation of the closing prices over the volatilityPeriod. When adaptive is false, a user-defined fixed value for sigma can be input.
Interpretation:
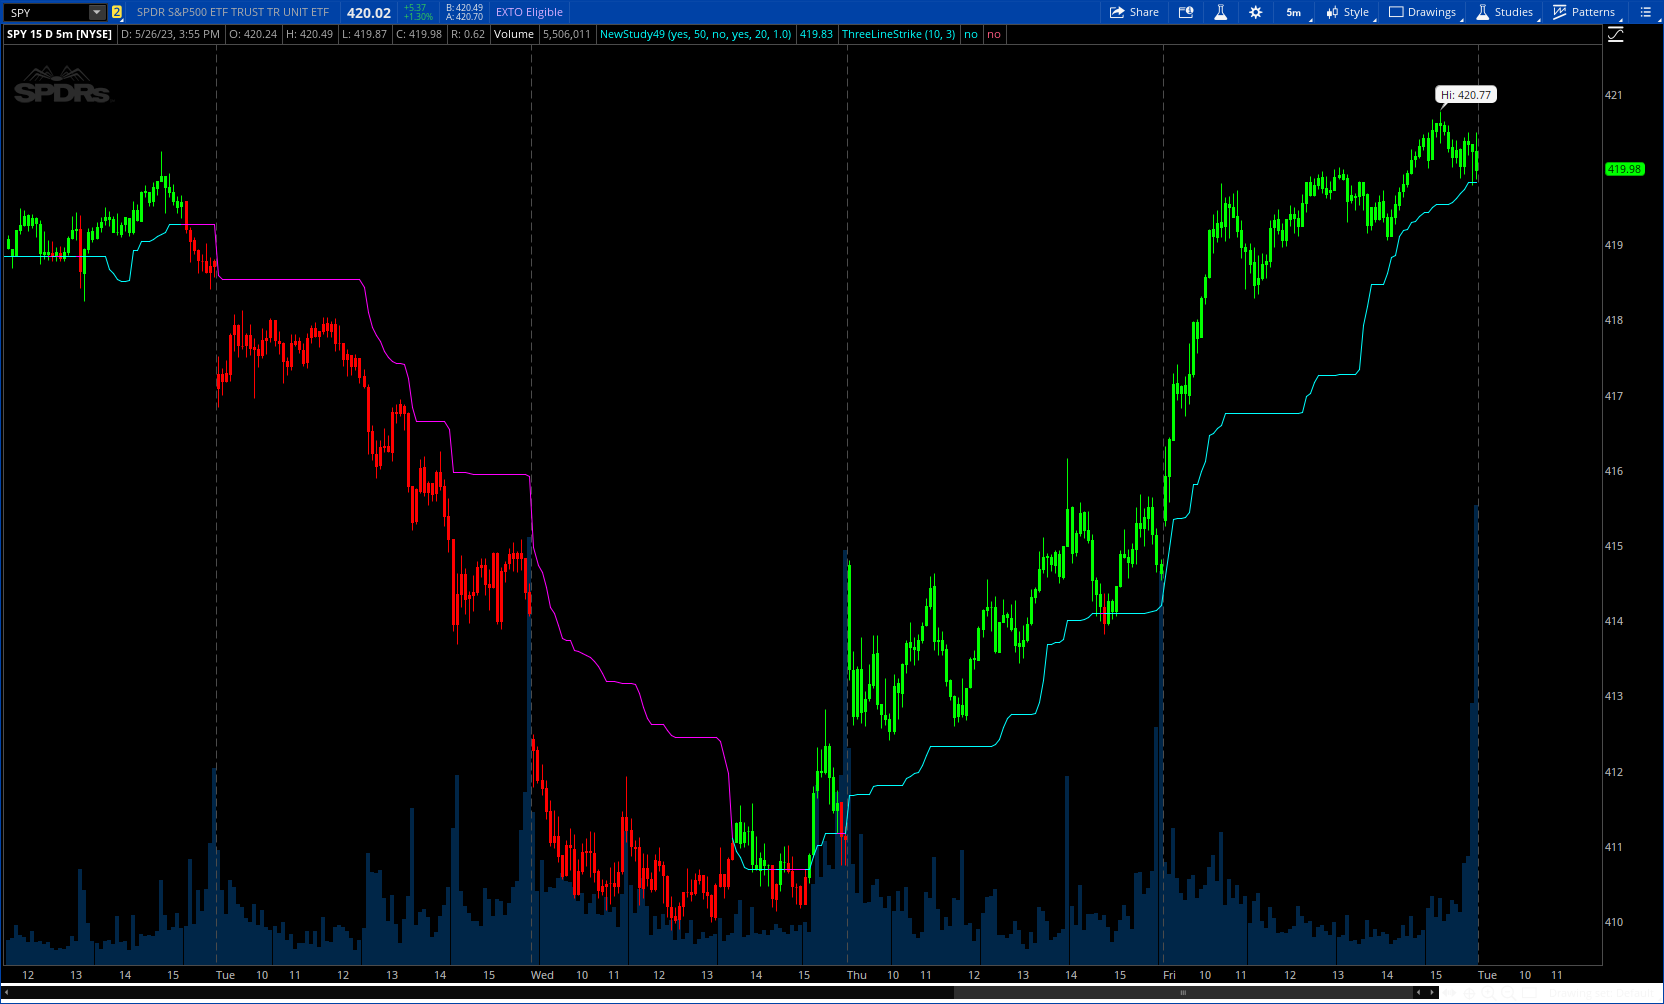
The AGMA generates a smoothed line that follows the trend of the price action. When the AGMA line is rising, it suggests an uptrend, while a declining line indicates a downtrend. The adaptive feature allows the indicator to adjust its sensitivity based on market volatility, making it more responsive during periods of high volatility and less sensitive during low volatility conditions.
Potential Uses in Strategies:
-- Trend Identification: Traders can use the AGMA to identify the direction of the prevailing trend. Buying opportunities may arise when the price is above the AGMA line during an uptrend, while selling opportunities may be considered when the price is below the AGMA line during a downtrend.
-- Trend Confirmation: The AGMA can be used in conjunction with other technical indicators or trend-following strategies to confirm the strength and sustainability of a trend. A strong and steady AGMA line can provide additional confidence in the prevailing trend.
-- Volatility-Based Strategies: Traders can utilize the adaptive feature of the AGMA to build volatility-based strategies. By adjusting the sigma value based on market volatility, the indicator can dynamically adapt to changing market conditions, potentially improving the accuracy of entry and exit signals.
CODE:
CSS:
#// This source code is subject to the terms of the Mozilla Public License 2.0 at https://mozilla.org/MPL/2.0/
#// © LeafAlgo
#indicator("Adaptive Gaussian Moving Average", overlay=true)
# conerted by Sam4Cok@Samer800    - 05/2023

input BarColor = yes;
input length = 38;                # "Length"
input useHighLowPrice = no;
input adaptive = yes;             # "Adaptive Parameters"
input volatilityPeriod = 20;      # "Volatility Period"
input StandardDeviation = 1.0;    # "Standard Deviation"

#// Calculate Gaussian Moving Average
def hiSrc = if useHighLowPrice then high else close;
def loSrc = if useHighLowPrice then low else close;
def src = if useHighLowPrice then hlc3 else close;

def sigma = if adaptive then stdev(src, volatilityPeriod) else StandardDeviation;

def gma_ = fold i = 0 to length with p do
          p + (((fold r = 0 to i + 1 with s=hiSrc do if s > GetValue(hiSrc,r) then s else GetValue(hiSrc,r)) +
                (fold m = 0 to i + 1 with t=loSrc do if t < GetValue(loSrc,m) then t else GetValue(loSrc,m))) *
                (exp(- power(((i - (length -1)) / (2 * sigma)), 2) / 2)));

def sumOfWeights = fold j = 0 to length with q do
                   q + (exp(-power(((j - (length -1)) / (2 * sigma)), 2) / 2));

def gma1 = (gma_ / sumOfWeights) / 2;
def gma = gma1;

def gmaColor = src >= gma;

plot GaussianMa = gma;    # "Gaussian Moving Average"

GaussianMa.AssignValueColor(if gmaColor then Color.CYAN else Color.MAGENTA);

AssignPriceColor(if !BarColor then Color.CURRENT else
                 if gmaColor then Color.GREEN else Color.RED);

#END of CODE