rloftinbiz
New member
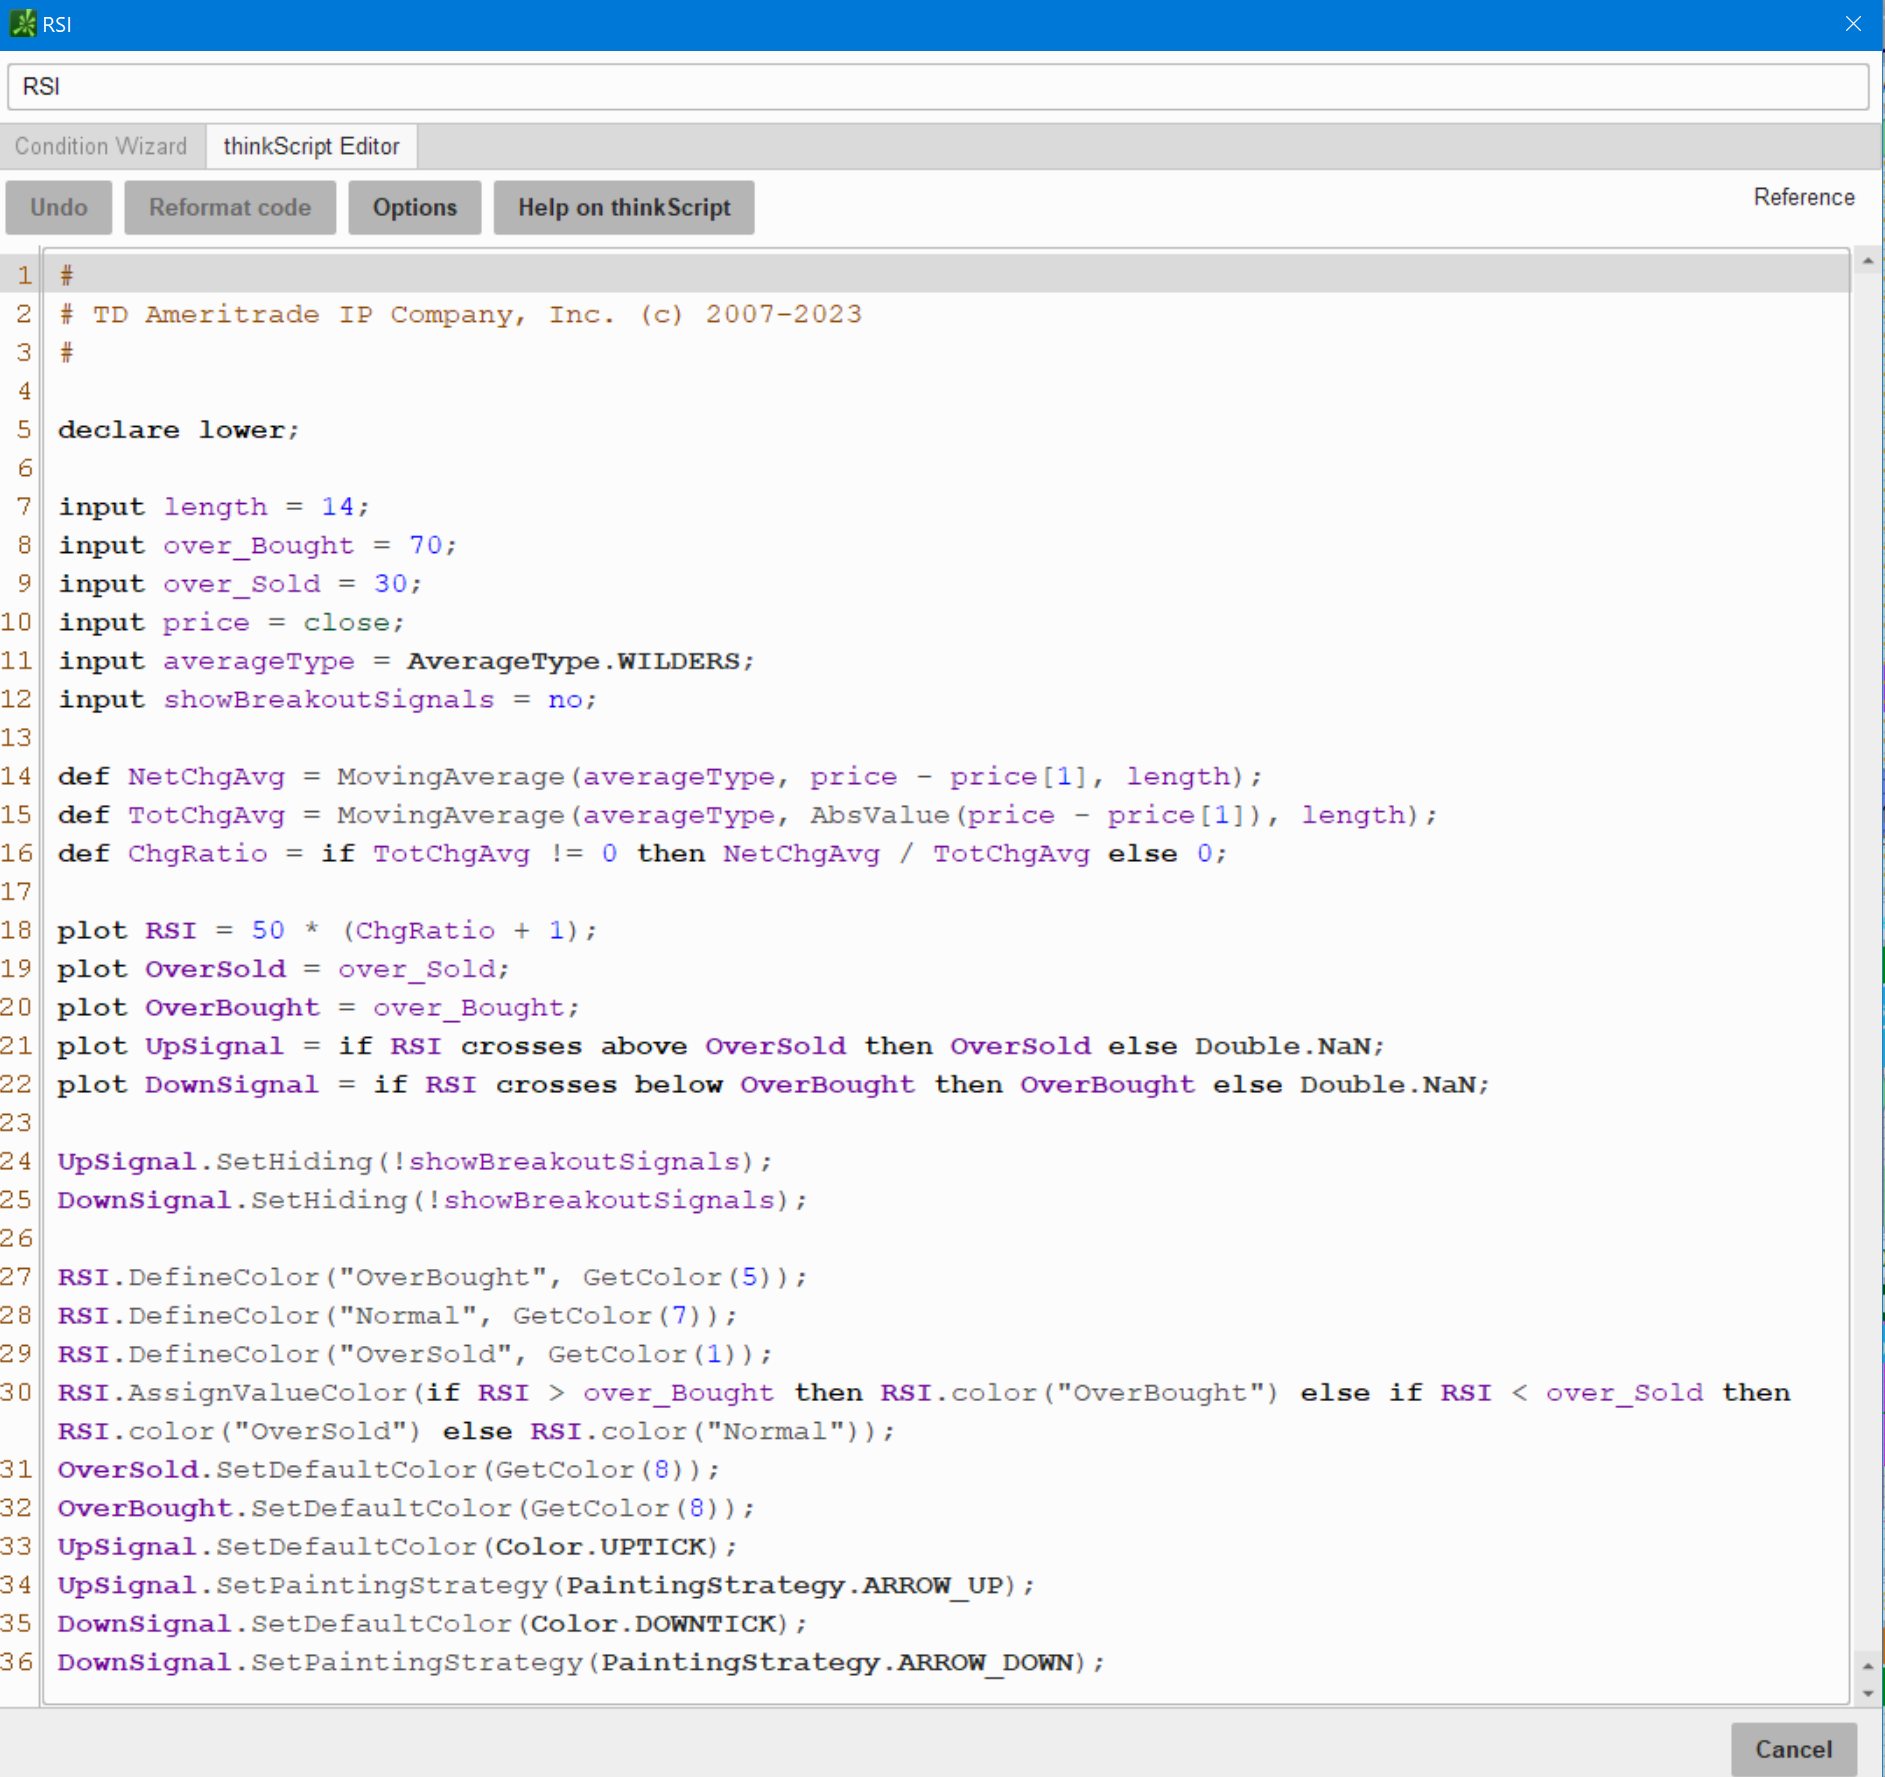
I want to recreate ThinkorSwim’s RSI function using AverageType.WILDERS on a different platform that matches ThinkorSwim’s results. As far as I can tell the close prices of both match historically for any instrument.
Current TOS code:
input RSI_len = 2;
input averageType = AverageType.WILDERS;
def RSI = RSI(length = RSI_len, averageType = averageType);
I can find pieces of the formula/code in TOS. From what I can tell TOS uses a look back period of 7 days for AverageType.WILDERS with ‘1’ as the dividend for Wilder in place of ‘2’ for a standard EMA.
Quotes from learning Center: --------------------------------------------------------------------------------------
“WildersSmoothing
Description
The Wilder's Smoothing study is similar to the Exponential Moving Average with the difference that Wilder's Smoothing uses a smoothing factor of 1/length which makes it respond more slowly to price changes compared to other moving averages.” --------------------
“MovAvgExponential
Description
The Exponential Moving Average (EMA) is a type of moving average that assigns greater weight to the most recent price data. Unlike the simple moving average where all data points have the same weight, the EMA's weighting factors to price data decrease exponentially.
The recursive representation of the EMA formula is the following:
EMA1 = price1;
EMA2 = α*price2 + (1 - α)*EMA1;
EMA3 = α*price3 + (1 - α)*EMA2;
EMAN = α*priceN + (1 - α)*EMAN-1;
where:
• N is the bar number;
• α is a smoothing coefficient equal to 2/(length + 1).”
-------------------------------------------------------------------------------------------------------------------
The is a simple scripting language from ProRealTime and my code to duplicate TOS:
‘[…]’ brackets indicate previous days, increasing numbers increase backwards in days.
-------------------------------------------------------------------------------------------------------------------
price1 = close
LookBack = 7
n0 = price1[0] - price1[1] //1st iteration today minus yesterday's price
if n0 > 0 then
u0 = n0
elsif n0 < 0 then
d0 = n0 * -1
else
u0 = 0
d0 = 0
endif
n1 = price1[1] - price1[2] //2nd iteration yesterday minus day-before-yesterday's price
if n1 > 0 then
u1 = n1
elsif n1 < 0 then
d1 = n1 * -1
else
u1 = 0
d1 = 0
endif
AvgPD = (u0 + u1) / 2 // simple average two-day gain
AvgND = (d0 + d1) / 2 // simple average two-day loss
a = 1/length + 1
// subtract yesterday from today for positive and negative price changes.
for i = 0 to LookBack do
diff = price1[length + i] - price1[length + 1 + i]
if diff > 0 then
diffP = diff
elsif diff < 0 then
diffN = diff * -1 // absolute value
else
diffP = 0
diffN = 0
endif
if i = 0 then // first averaging step
AvgP = AvgPD
AvgN = AvgND
else // subsequent averaging steps
AvgP = a * diffP + (1 - a) * AvgP
AvgN = a * diffN + (1 - a) * AvgN
endif
next
RS = AvgP/AvgN
xRSI = 100-(100/(1+RS))
return xRSI
Unfortunately, the above code does not work. Adjusting the ‘LookBack’ period seems to shift the entire calculation in time with zero ‘LookBack’ (meaning no look-back at all) the closet to TSO. I don’t think what I’m doing is near correct. Unsure why it is so difficult for find out the math or code used. Any help is sincerely appreciated.