Actionable Daily Historical Volatility for ThinkorSwim

BenTen

Administrative
Staff member
Staff
VIP
Lifetime
This indicator uses historical volatility of the last 10 and 100 days.
Some research points to combining the 10 and 100 day historical volatility (HV) indicators can help identify HV signals.

Volatility measures the extent of price changes, but doesn't indicate the direction of the change.
Some suggest imbuing direction with the use of 20 bar moving average.

Suggestion:
Look for an entry zone when the close has crossed above its 20 day moving average, and when Historical Volatility Indicator was .5 or lower within the last 10 days.
Exit Zones when close crosses below its 20 day moving average, and when Historical Volatility Indicator was .5 or lower within the last 10 days.

UfEXvIe.png


thinkScript Code

Code:
# Actionable Daily Historical Volatility
# Assembled by BenTen at useThinkScript.com
# Converted from https://www.tradingview.com/script/141g43Qm/

declare lower;

# Historical Volatility 10 day
def HV = stdev(log(close / close[1]), 10) * sqrt(365) * 100;
# Historical Volatility 100 day
def HV1 = stdev(log(close / close[1]), 100) * sqrt(365) * 100;

assignPriceColor(if HV>HV1 and HV[1]<HV1[1] then Color.Green else if HV<HV1 and HV[1]> HV1[1] then Color.Red else Color.White);

plot tenHV = HV;
plot HundredHV = HV1;

tenHV.SetDefaultColor(GetColor(1));
HundredHV.SetDefaultColor(GetColor(0));

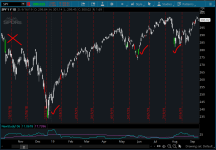
I think you should look at the daily chart first for this particular indicator. On $SPY it definitely spotted some nice bullish reversal signals.

BwKvYB0.png


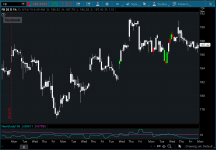
It doesn't hurt to test on lower timeframes either :)
 

Attachments

  • UfEXvIe.png
    UfEXvIe.png
    90.7 KB · Views: 233
  • BwKvYB0.png
    BwKvYB0.png
    108.3 KB · Views: 235
Last edited by a moderator:
Before anyone depends on this indicator make sure you read about HV. My understanding is it shows historical volatility of a stock without regard to direction. So how does this indicator function to choose a direction ? Makes little sense to me. Maybe someone can explain.
 
@horserider you are correct that historical volatility on its own does not function to choose direction.
In this case, the code seems to compare the 10 day to the 100 day, so in this case looking at whether something is above or below, higher or lower, may give some sort of signal. Utility is, of course, up to the person using the indicator.
 
Hi Ben,

Is it possible to change the script to plot the ratio of the six-day historical volatility reading to the 100-day historical volatility reading? This is one of the trading techniques discussed in Street Smarts by LBR (Chapter 20, Historical volatility meets Toby Crabel).

Thanks!
 
@jma A slight modification to the script will give you what you want:

Code:
def HV1 = stdev(log(close / close[1]), 6) * sqrt(365) * 100;
 
Hi Ben,

Thank you so much for such a quick response. Sorry I know little about Thinkscript so please excuse my ignorance. If you make this change, I assume it changes the 10-period historical volatility to 6-period historical volatility. I also assume you meant def HV instead of def HV1 since HV1 is the 100-period historical volatility.

My question is: How do you plot the ratio of a 6-period historical volatility to 100-period historical volatility?

Thanks again for your time!
 
@jma I'm slightly confused about your request. The current indicator plot the 10 and 100 days historical volatility values. Do you want to keep the 100-day and change 10-day to 6-day?
 
Sorry if I did not make my request clear. I do NOT want to plot either the 6-day or 100-day historical volatility. Rather I would like to just plot the ratio of the 6-day historical volatility to the 100-day historical volatility:

6-day historical volatility divided by 100-day historical volatility

Thanks!
 
@jma I see. Try this:

Code:
# Actionable Daily Historical Volatility
# Assembled by BenTen at useThinkScript.com
# Converted from https://www.tradingview.com/script/141g43Qm/

declare lower;

# Historical Volatility 6 day
def HV = stdev(log(close / close[1]), 6) * sqrt(365) * 100;
# Historical Volatility 100 day
def HV1 = stdev(log(close / close[1]), 100) * sqrt(365) * 100;

plot ratio = HV / HV1;
 
Hi Ben,

Is it possible to change the script to plot the ratio of the six-day historical volatility reading to the 100-day historical volatility reading? This is one of the trading techniques discussed in Street Smarts by LBR (Chapter 20, Historical volatility meets Toby Crabel).

Thanks!

BenTen gave of course the perfect reply. I am just going through Street Smarts and it's a gold mine! In the book they use 6 - but also mention that 10 is used for longer timeframes - so I made it changeable. And I added a white line at 0.5


Code:
# Actionable Daily Historical Volatility
# Assembled by BenTen at useThinkScript.com
# Converted from https://www.tradingview.com/script/141g43Qm/

declare lower;

input period = 6;

# Historical Volatility 6 day
def HV = stdev(log(close / close[1]), period) * sqrt(365) * 100;
# Historical Volatility 100 day
def HV1 = stdev(log(close / close[1]), 100) * sqrt(365) * 100;

plot ratio = HV / HV1;

# Add a horizontal line at y = 0.5
plot hline = 0.5;
hline.SetDefaultColor(Color.WHITE);
hline.SetStyle(Curve.LONG_DASH);
 
Building on the work of @BenTen and @Yello, I've taken the liberty of adding a switch/case statement to remember the short-term and long-term settings...

Code:
# Actionable Daily Historical Volatility
# Assembled by BenTen at useThinkScript.com
# Converted from https://www.tradingview.com/script/141g43Qm/

declare lower;

input periodLength = {default ShortTerm, LongTerm};

def period;
switch(periodLength) {
case ShortTerm:
     period = 6;
case LongTerm:
     period = 10;
};

# Historical Volatility 6 day
def HV = stdev(log(close / close[1]), period) * sqrt(365) * 100;
# Historical Volatility 100 day
def HV1 = stdev(log(close / close[1]), 100) * sqrt(365) * 100;

plot ratio = HV / HV1;

# Add a horizontal line at y = 0.5
plot hline = 0.5;
hline.SetDefaultColor(Color.WHITE);
hline.SetStyle(Curve.LONG_DASH);

Hope this helps...

Good Luck and Good Trading :cool:
 

Join useThinkScript to post your question to a community of 21,000+ developers and traders.

Similar threads

Not the exact question you're looking for?

Start a new thread and receive assistance from our community.

87k+ Posts
388 Online
Create Post

Similar threads

Similar threads

The Market Trading Game Changer

Join 2,500+ subscribers inside the useThinkScript VIP Membership Club
  • Exclusive indicators
  • Proven strategies & setups
  • Private Discord community
  • ‘Buy The Dip’ signal alerts
  • Exclusive members-only content
  • Add-ons and resources
  • 1 full year of unlimited support

Frequently Asked Questions

What is useThinkScript?

useThinkScript is the #1 community of stock market investors using indicators and other tools to power their trading strategies. Traders of all skill levels use our forums to learn about scripting and indicators, help each other, and discover new ways to gain an edge in the markets.

How do I get started?

We get it. Our forum can be intimidating, if not overwhelming. With thousands of topics, tens of thousands of posts, our community has created an incredibly deep knowledge base for stock traders. No one can ever exhaust every resource provided on our site.

If you are new, or just looking for guidance, here are some helpful links to get you started.

What are the benefits of VIP Membership?
VIP members get exclusive access to these proven and tested premium indicators: Buy the Dip, Advanced Market Moves 2.0, Take Profit, and Volatility Trading Range. In addition, VIP members get access to over 50 VIP-only custom indicators, add-ons, and strategies, private VIP-only forums, private Discord channel to discuss trades and strategies in real-time, customer support, trade alerts, and much more. Learn all about VIP membership here.
How can I access the premium indicators?
To access the premium indicators, which are plug and play ready, sign up for VIP membership here.
Back
Top