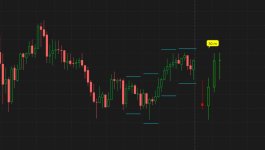
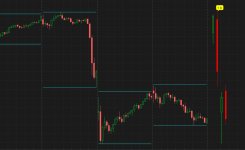
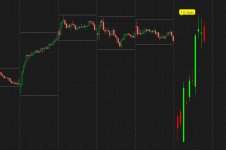
this draws 4 candles after the last bar,
that represent the last 4 - 2nd agg time periods on the chart.
can pick the 2nd aggregation time.
horizontal lines are drawn above and below each period of bars.
i made this from a request.
https://usethinkscript.com/threads/daily-candle-on-one-minute-chart.20588/
a couple of ref links are below
refs
4 MTF bars after last bar
https://usethinkscript.com/threads/...candles-after-last-bar-for-thinkorswim.13328/
agg label
https://usethinkscript.com/threads/need-help-adding-prices-for-major-indices.7308/#post-70581
that represent the last 4 - 2nd agg time periods on the chart.
can pick the 2nd aggregation time.
horizontal lines are drawn above and below each period of bars.
i made this from a request.
https://usethinkscript.com/threads/daily-candle-on-one-minute-chart.20588/
a couple of ref links are below
Code:
#mtf_candle_exp_area_01

def na = double.nan;
def cls2 = if isnan(close) then cls2[1] else close;

DefineGlobalColor("agg_lines", color.gray);
#GlobalColor("agg_lines")

input agg = AggregationPeriod.day;
input multiplier = 0.001;

#----------------------
# read agg data before last bar
def b1 = (!isnan(close(period=agg)[-3]) and isnan(close(period=agg)[-4]));
def o1;
def h1;
def l1;
def c1;
if b1 then {
 o1 = open(period=agg);
 h1 = high(period=agg);
 l1 = low(period=agg);
 c1 = close(period=agg);
} else {
 o1 = o1[1];
 h1 = h1[1];
 l1 = l1[1];
 c1 = c1[1];
}

plot zh1 = if b1 then h1*(1+multiplier) else na;
plot zl1 = if b1 then l1*(1-multiplier) else na;
zh1.SetDefaultColor(GlobalColor("agg_lines"));
zl1.SetDefaultColor(GlobalColor("agg_lines"));
zh1.hidebubble();
zl1.hidebubble();
#----------------------
def b2 = (!isnan(close(period=agg)[-2]) and isnan(close(period=agg)[-3]));
def o2;
def h2;
def l2;
def c2;
if b2 then {
 o2 = open(period=agg);
 h2 = high(period=agg);
 l2 = low(period=agg);
 c2 = close(period=agg);
} else {
 o2 = o2[1];
 h2 = h2[1];
 l2 = l2[1];
 c2 = c2[1];
}

plot zh2 = if b2 then h2*(1+multiplier) else na;
plot zl2 = if b2 then l2*(1-multiplier) else na;
zh2.SetDefaultColor(GlobalColor("agg_lines"));
zl2.SetDefaultColor(GlobalColor("agg_lines"));
zh2.hidebubble();
zl2.hidebubble();
#----------------------
def b3 = (!isnan(close(period=agg)[-1]) and isnan(close(period=agg)[-2]));
def o3;
def h3;
def l3;
def c3;
if b3 then {
 o3 = open(period=agg);
 h3 = high(period=agg);
 l3 = low(period=agg);
 c3 = close(period=agg);
} else {
 o3 = o3[1];
 h3 = h3[1];
 l3 = l3[1];
 c3 = c3[1];
}

plot zh3 = if b3 then h3*(1+multiplier) else na;
plot zl3 = if b3 then l3*(1-multiplier) else na;
zh3.SetDefaultColor(GlobalColor("agg_lines"));
zl3.SetDefaultColor(GlobalColor("agg_lines"));
zh3.hidebubble();
zl3.hidebubble();
#----------------------
def b4 = (!isnan(close(period=agg)[0]) and isnan(close(period=agg)[-1]));
def o4;
def h4;
def l4;
def c4;
if b4 then {
 o4 = open(period=agg);
 h4 = high(period=agg);
 l4 = low(period=agg);
 c4 = close(period=agg);
} else {
 o4 = o4[1];
 h4 = h4[1];
 l4 = l4[1];
 c4 = c4[1];
}

plot zh4 = if b4 then h4*(1+multiplier) else na;
plot zl4 = if b4 then l4*(1-multiplier) else na;
zh4.SetDefaultColor(GlobalColor("agg_lines"));
zl4.SetDefaultColor(GlobalColor("agg_lines"));
zh4.hidebubble();
zl4.hidebubble();
#----------------------

# colored column placements, bars after last bar
input offset = 3;
def spac = 2;
def x1 = (!isnan(close[offset+(0*spac)]) and isnan(close[(offset+(0*spac))-1]));
def x2 = (!isnan(close[offset+(1*spac)]) and isnan(close[(offset+(1*spac))-1]));
def x3 = (!isnan(close[offset+(2*spac)]) and isnan(close[(offset+(2*spac))-1]));
def x4 = (!isnan(close[offset+(3*spac)]) and isnan(close[(offset+(3*spac))-1]));
#----------------------

def c1h = if x1 then h1 else na;
def c1l = if x1 then l1 else na;
def c1ogrn = if x1 and o1<=c1 then o1 else na;
def c1cgrn = if x1 and o1<=c1 then c1 else na;
def c1ored = if x1 and o1>c1 then o1 else na;
def c1cred = if x1 and o1>c1 then c1 else na;
#AddChart(high = c1h, low = c1l, open = c1ogrn, close = c1cgrn, type = ChartType.CANDLE, growcolor = color.green);
# swap open/close data for green candle, so body is filled in
AddChart(high = c1h, low = c1l, open = c1cgrn, close = c1ogrn, type = ChartType.CANDLE, growcolor = color.green);
AddChart(high = c1h, low = c1l, open = c1ored, close = c1cred, type = ChartType.CANDLE, growcolor = color.red);

def c2h = if x2 then h2 else na;
def c2l = if x2 then l2 else na;
def c2ogrn = if x2 and o2<=c2 then o2 else na;
def c2cgrn = if x2 and o2<=c2 then c2 else na;
def c2ored = if x2 and o2>c2 then o2 else na;
def c2cred = if x2 and o2>c2 then c2 else na;
#AddChart(high = c2h, low = c2l, open = c2ogrn, close = c2cgrn, type = ChartType.CANDLE, growcolor = color.green);
AddChart(high = c2h, low = c2l, open = c2cgrn, close = c2ogrn, type = ChartType.CANDLE, growcolor = color.green);
AddChart(high = c2h, low = c2l, open = c2ored, close = c2cred, type = ChartType.CANDLE, growcolor = color.red);

def c3h = if x3 then h3 else na;
def c3l = if x3 then l3 else na;
def c3ogrn = if x3 and o3<=c3 then o3 else na;
def c3cgrn = if x3 and o3<=c3 then c3 else na;
def c3ored = if x3 and o3>c3 then o3 else na;
def c3cred = if x3 and o3>c3 then c3 else na;
#AddChart(high = c3h, low = c3l, open = c3ogrn, close = c3cgrn, type = ChartType.CANDLE, growcolor = color.green);
AddChart(high = c3h, low = c3l, open = c3cgrn, close = c3ogrn, type = ChartType.CANDLE, growcolor = color.green);
AddChart(high = c3h, low = c3l, open = c3ored, close = c3cred, type = ChartType.CANDLE, growcolor = color.red);

def c4h = if x4 then h4 else na;
def c4l = if x4 then l4 else na;
def c4ogrn = if x4 and o4<=c4 then o4 else na;
def c4cgrn = if x4 and o4<=c4 then c4 else na;
def c4ored = if x4 and o4>c4 then o4 else na;
def c4cred = if x4 and o4>c4 then c4 else na;
#AddChart(high = c4h, low = c4l, open = c4ogrn, close = c4cgrn, type = ChartType.CANDLE, growcolor = color.green);
AddChart(high = c4h, low = c4l, open = c4cgrn, close = c4ogrn, type = ChartType.CANDLE, growcolor = color.green);
AddChart(high = c4h, low = c4l, open = c4ored, close = c4cred, type = ChartType.CANDLE, growcolor = color.red);
#----------------------

def bubpr = max(h1,max(h2,max(h3,h4)));
def aggmin =  agg/60000;
def y = 0.001;
addchartbubble(x1,bubpr*(1+y),
  (if aggmin < 60 then (aggmin + " m")
  else if aggmin < 1440 then ((aggmin/60) + " H")
  else if aggmin < 10080 then (aggmin/(60*24) + " D")
  else if agg == aggregationPeriod.WEEK then "W"
  else if agg == aggregationPeriod.MONTH then "M"
  else "") + "  bars"
, Color.yellow, yes);

#----------------------

addchartbubble(0 and x1,94.8,
bubpr + "\n" +
h1 + "\n" +
h2 + "\n" +
h3 + "\n" +
h4 + "\n"
, color.cyan, yes);

#----------------------
#refs

# 4 MTF bars after last bar
# https://usethinkscript.com/threads/4-mtf-price-ranges-simulated-candles-after-last-bar-for-thinkorswim.13328/

# agg label
# https://usethinkscript.com/threads/need-help-adding-prices-for-major-indices.7308/#post-70581
#
refs
4 MTF bars after last bar
https://usethinkscript.com/threads/...candles-after-last-bar-for-thinkorswim.13328/
agg label
https://usethinkscript.com/threads/need-help-adding-prices-for-major-indices.7308/#post-70581