



Scroll down to check out this week's must reads, carefully selected by uTS Moderators!

Adaptive Universal Oscillator
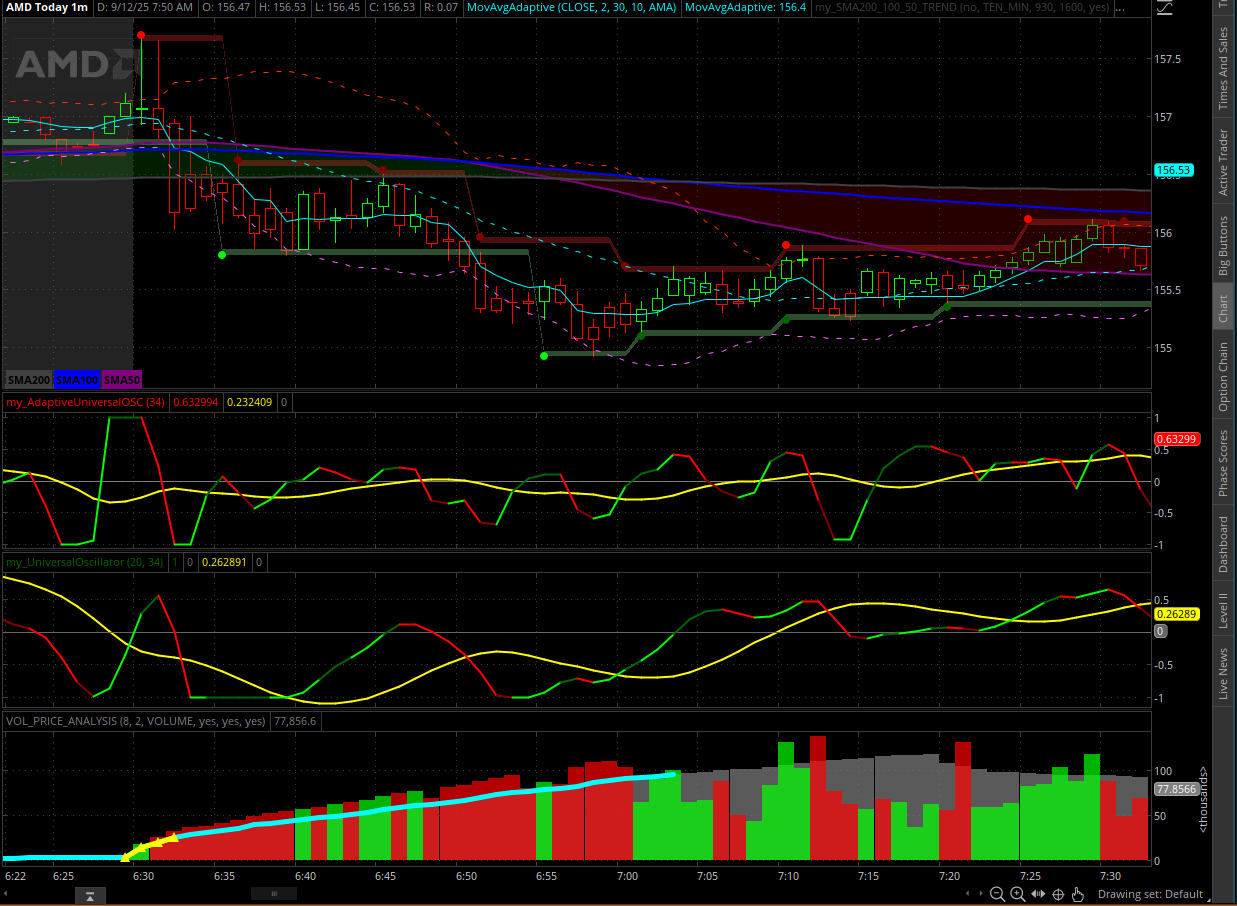
Sesqui said:Here is another adaptive indicator but it uses a different approach.
The universal oscillator has essentially zero lag as an indicator however its implementation in TOS is not adaptive.
The indicator below changes the sensitivity to price moves using the volatility in much the same way as the TOS MovAvgAdaptive indicator. It becomes more sensitive when the price is moving smoothly and less sensitive when the price is volatile...
Read more
https://usethinkscript.com/threads/adaptive-universal-oscillator-for-thinkorswim.21588/
CCI Upper Bands with Volatility Squeeze
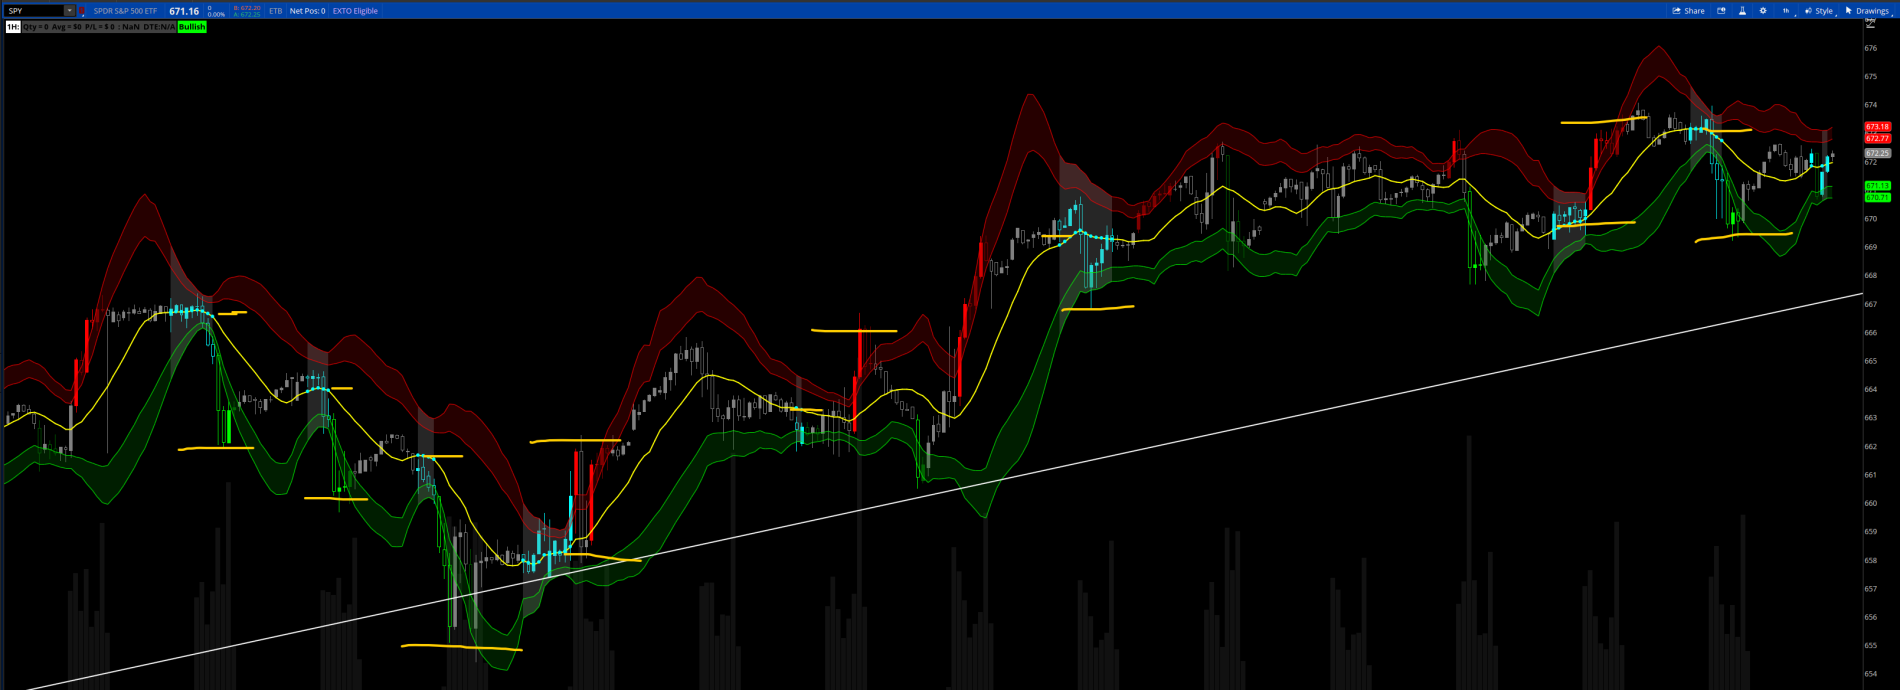
chewie76 said:This is the CCI on the upper chart using 100 and 150 levels as bands. It also indicates squeezes in volatility. These squeezes are highlighted in cyan color bars, shaded areas, and cyan dots. Below is the SPY on a 1 hour chart.
Notice the squeeze zones and the breakouts. These are good areas to place a straddle option trade as you know a move will take place, but not sure what direction. The sensitivity of the squeezes can be adjusted in the setting. Default is 0.618.
Read more
https://usethinkscript.com/threads/cci-upper-bands-with-volatility-squeeze-for-thinkorswim.21671/
VIP SUBSCRIBERS ONLY |
Reading the Tide: Tracking Market Rotation
merryDay said:In trading, information is power — but context is what turns that information into profit.
Markets are driven by liquidity, sentiment, and institutional allocation. For short-term momentum traders and intraday reversal hunters, knowing where the money is flowing — and where it’s retreating — is everything.
Take today’s market action: on the surface, it looked broadly negative. But beneath that surface, money was quietly rotating between sectors and asset classes. Spotting those flows — and positioning accordingly — is what separates the prepared trader from the reactive one.
Read more
https://usethinkscript.com/threads/reading-the-tide-tracking-market-rotation.21675/

Join our VIP Members Club to get access to our premium indicators including Buy The Dip, Advanced Market Moves and Take Profit.
Your VIP membership includes:
✓Full access to public & private forums
✓No Ads
✓Priority community support
✓Unlimited Postings
✓Premium thinkorswim indicators
✓Exclusive strategies, scanners, add-ons
✓Discord chatroom with Trade Alerts
VIP Membership
Option Premium - Ichimoku Cloud
Predemption239 said:Been trading options for years, have had great success with SPX 0DTE with this setup, and sometimes weeklies depending on the VIX.
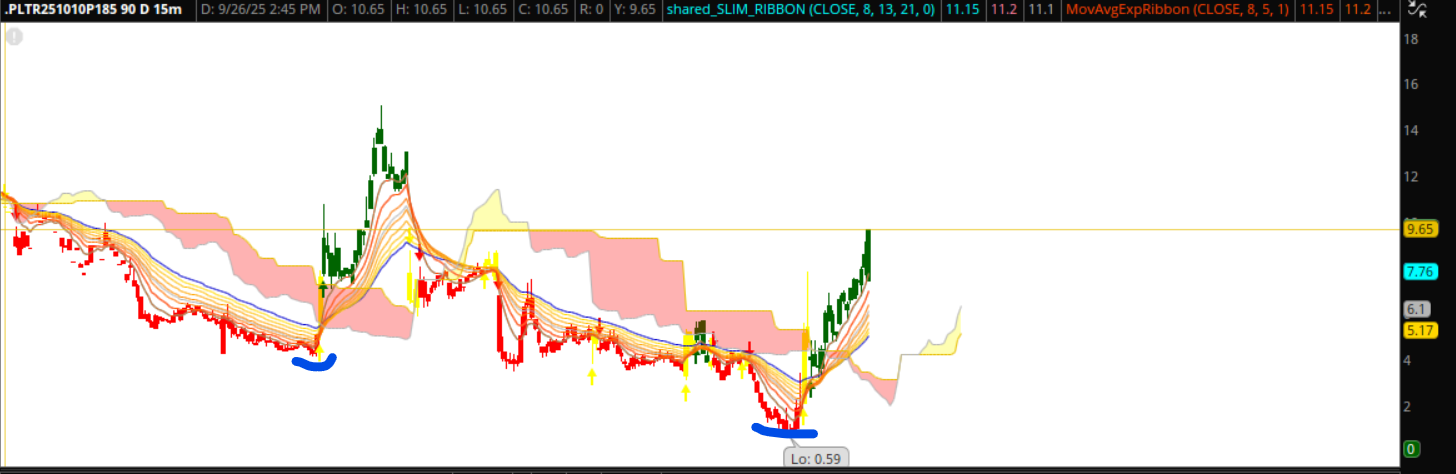
1st, here's the Chart Setup, strictly the Ichimoku Cloud on an Option Premium Chart.
As Price gets below the cloud, chops and gets very-thin-in-price-action, that's where I sometimes load in. Other times I want an EMA or an EMA Ribbon to cross over, but sometimes you've already missed the 100% spike, but can still ride another 100% to 500% which is still great.
Read more
https://usethinkscript.com/threads/option-premium-ichimoku-cloud-for-thinkorswim.21683/
FROM THE ARCHIVES |
Auto Fib (Fibonacci) Levels Indicator
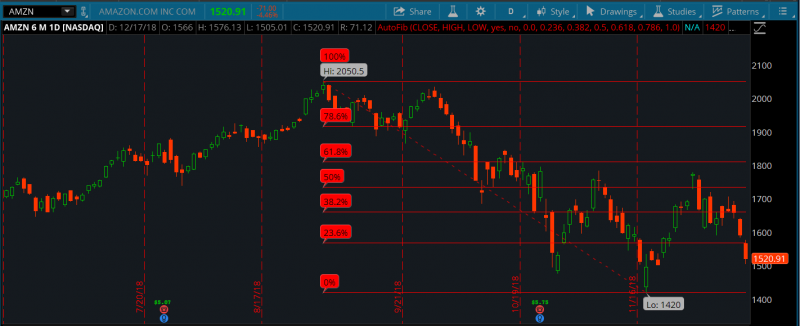
tomsk said:Fibonacci retracements use horizontal lines to indicate areas of support or resistance at the key Fibonacci levels before it continues in the original direction. These levels are created by drawing a trendline between two extreme points and then dividing the vertical distance by the key Fibonacci ratios of: 23.6%, 38.2%, 50%, 61.8%, 78.6%, and 100%.
Folks here is version 1.3 of the Auto Fib study that now displays the bubbles on the right of the chart
Please ensure that you increase the expansion area to that the bubbles have room to be displayed.
Read more
https://usethinkscript.com/threads/auto-fib-fibonacci-levels-indicator-for-thinkorswim.14/
Last edited by a moderator:

