



Scroll down to check out this week's must reads, carefully selected by uTS Moderators!

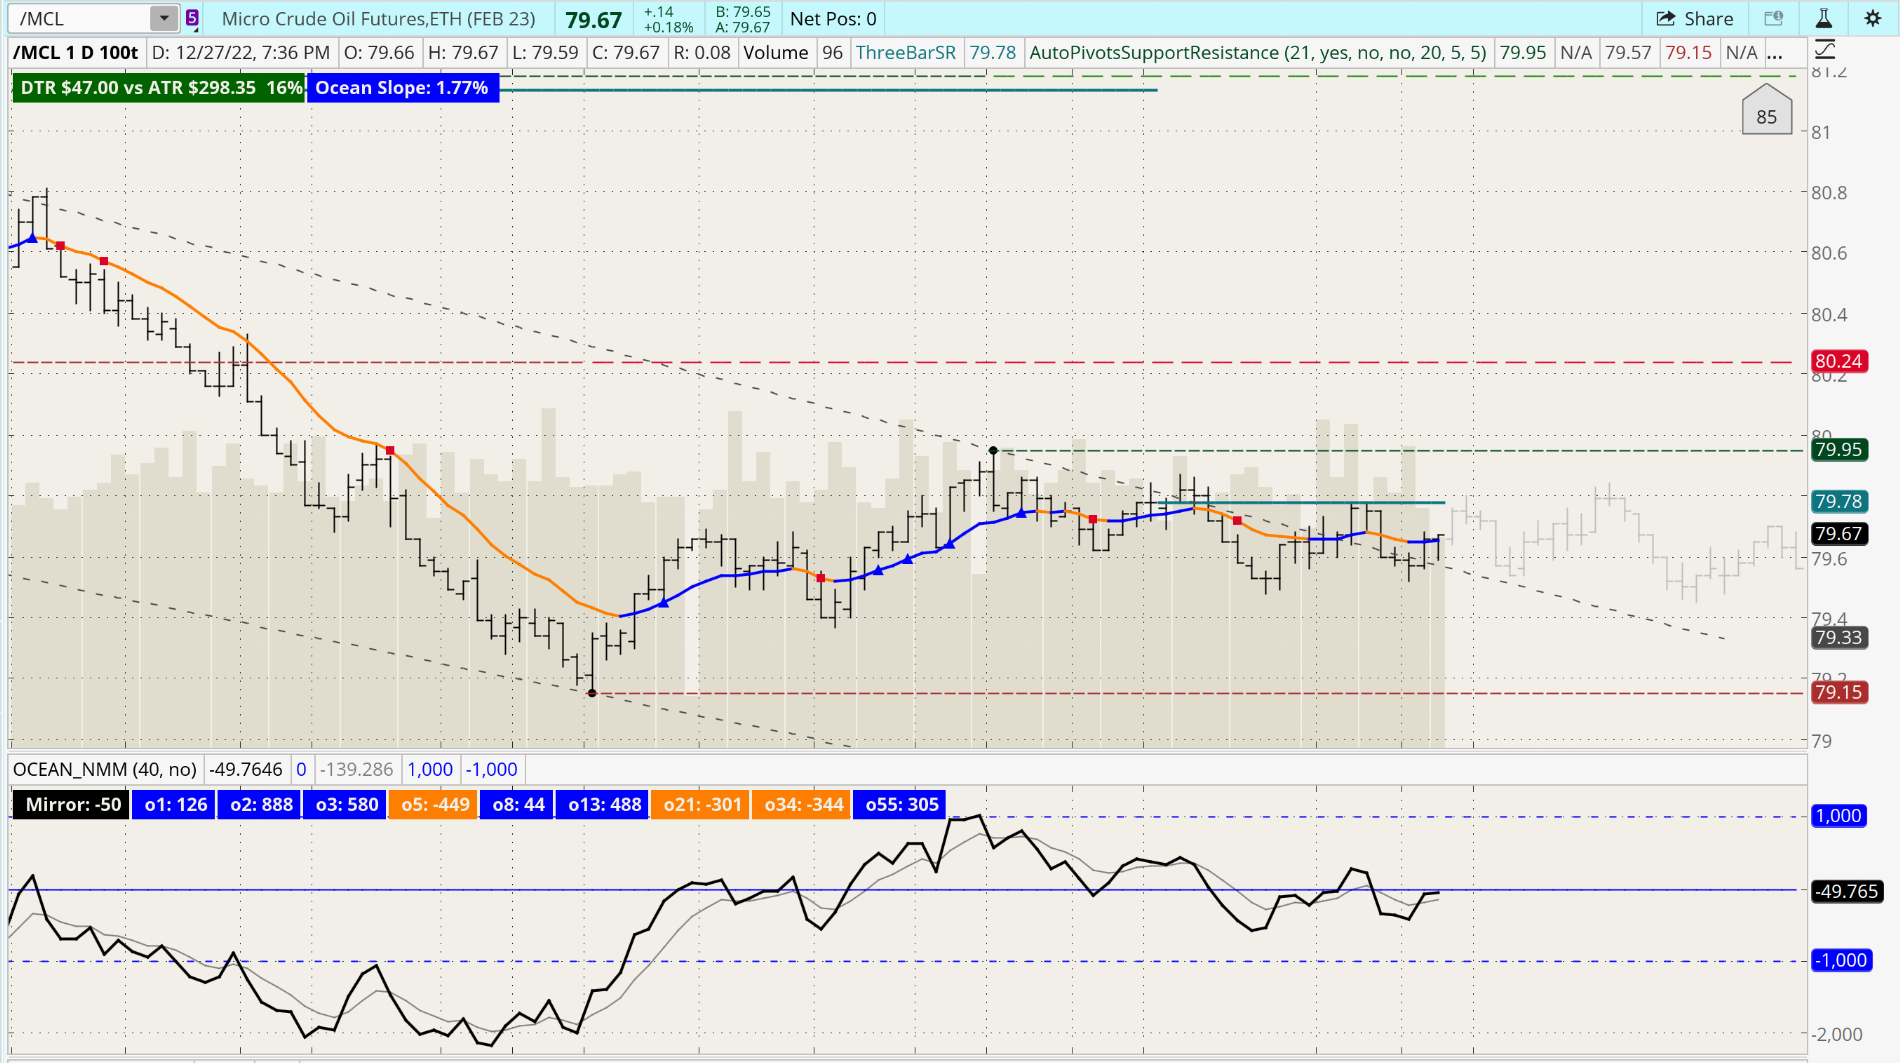
OCEAN -- Natural Market Mirror and Adam Studies
mashume said:Having spent a weekend reading Jim Sloman's Introduction to Ocean Theory, I wrote up a few indicators... I'm not convinced there's a lot of value in this as a technical indicator, but it has been talked about a lot recently and presented an interesting challenge (especially the Adam indicator).
The code for the Natural Market River is somewhere in the first one as well... I didn't find it useful enough to do anything with beyond commenting it out.
Read more
https://usethinkscript.com/threads/...irror-and-adam-studies-for-thinkorswim.13852/
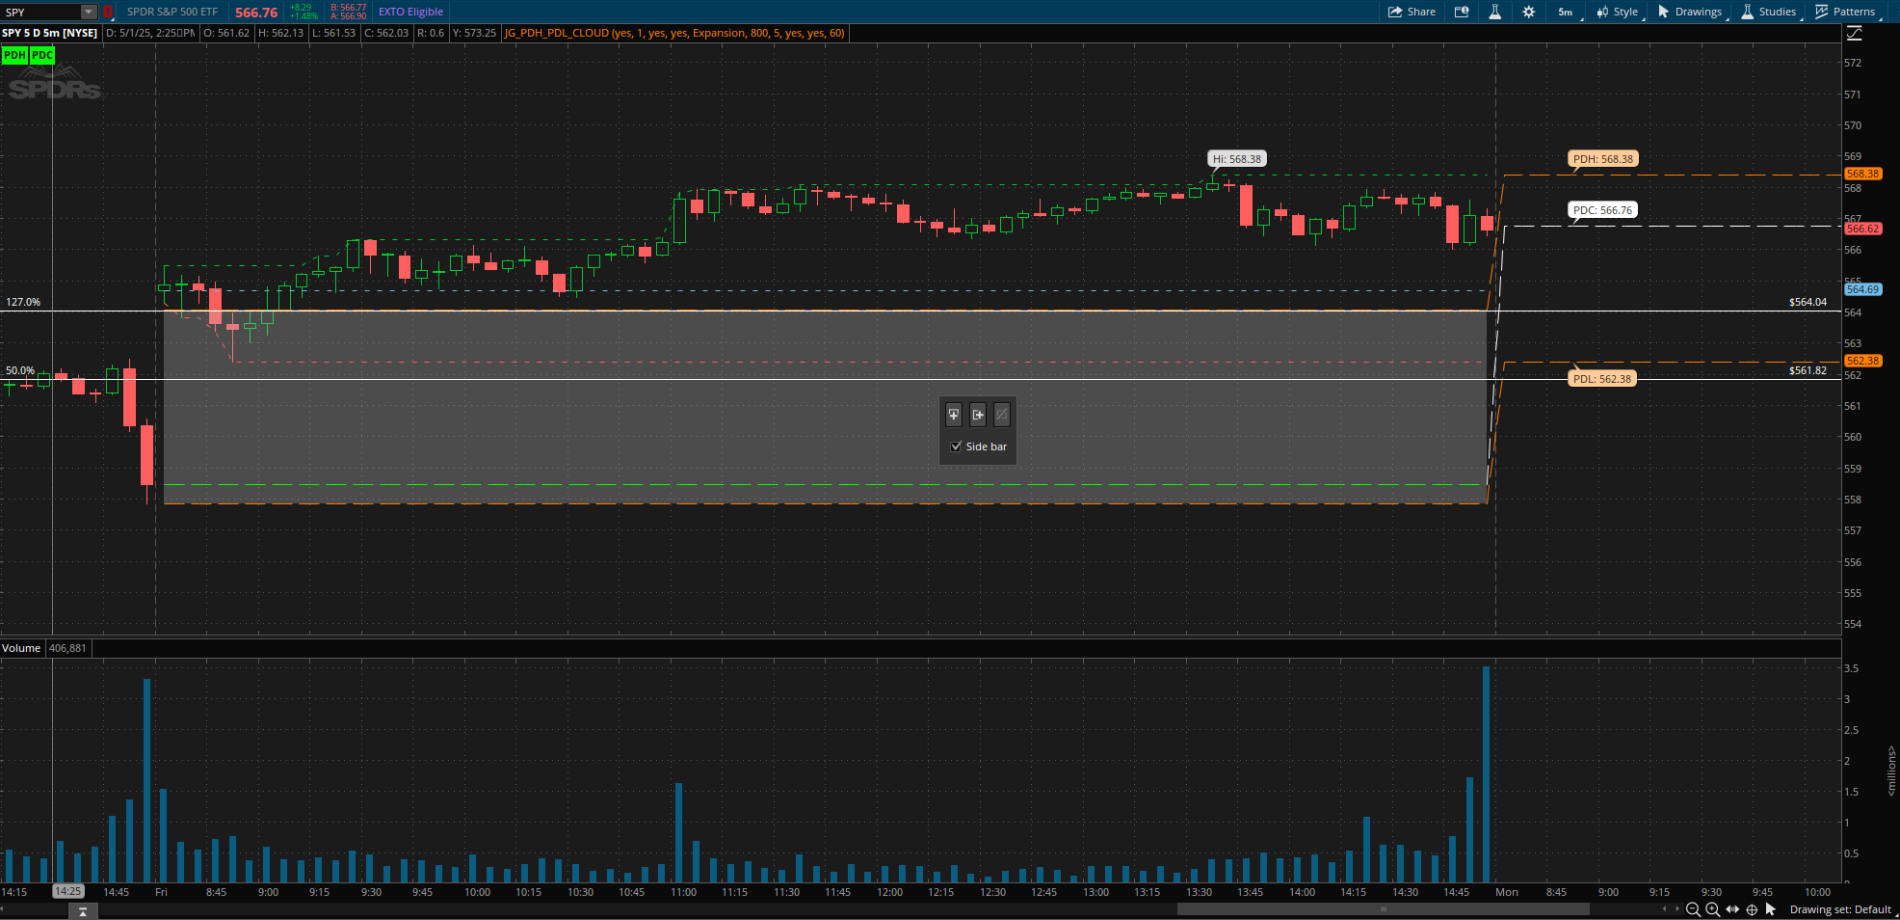
Previous Day High Low Rectangle
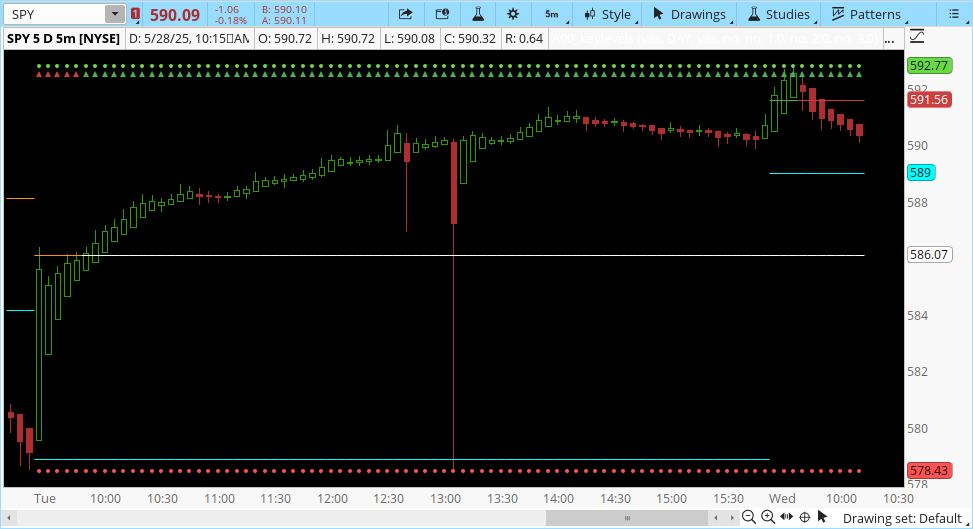
Ajordan930 said:Here is a slight modification that draws a rectangle automatically of the previous days high and lows showing that range. Also currently plots dotted line for today's high/low/open. Also has labels that will show green if above, red if below, and yellow if in-between.
Read more
https://usethinkscript.com/threads/previous-day-high-low-rectangle-for-thinkorswim.21003/
VIP SUBSCRIBERS ONLY |
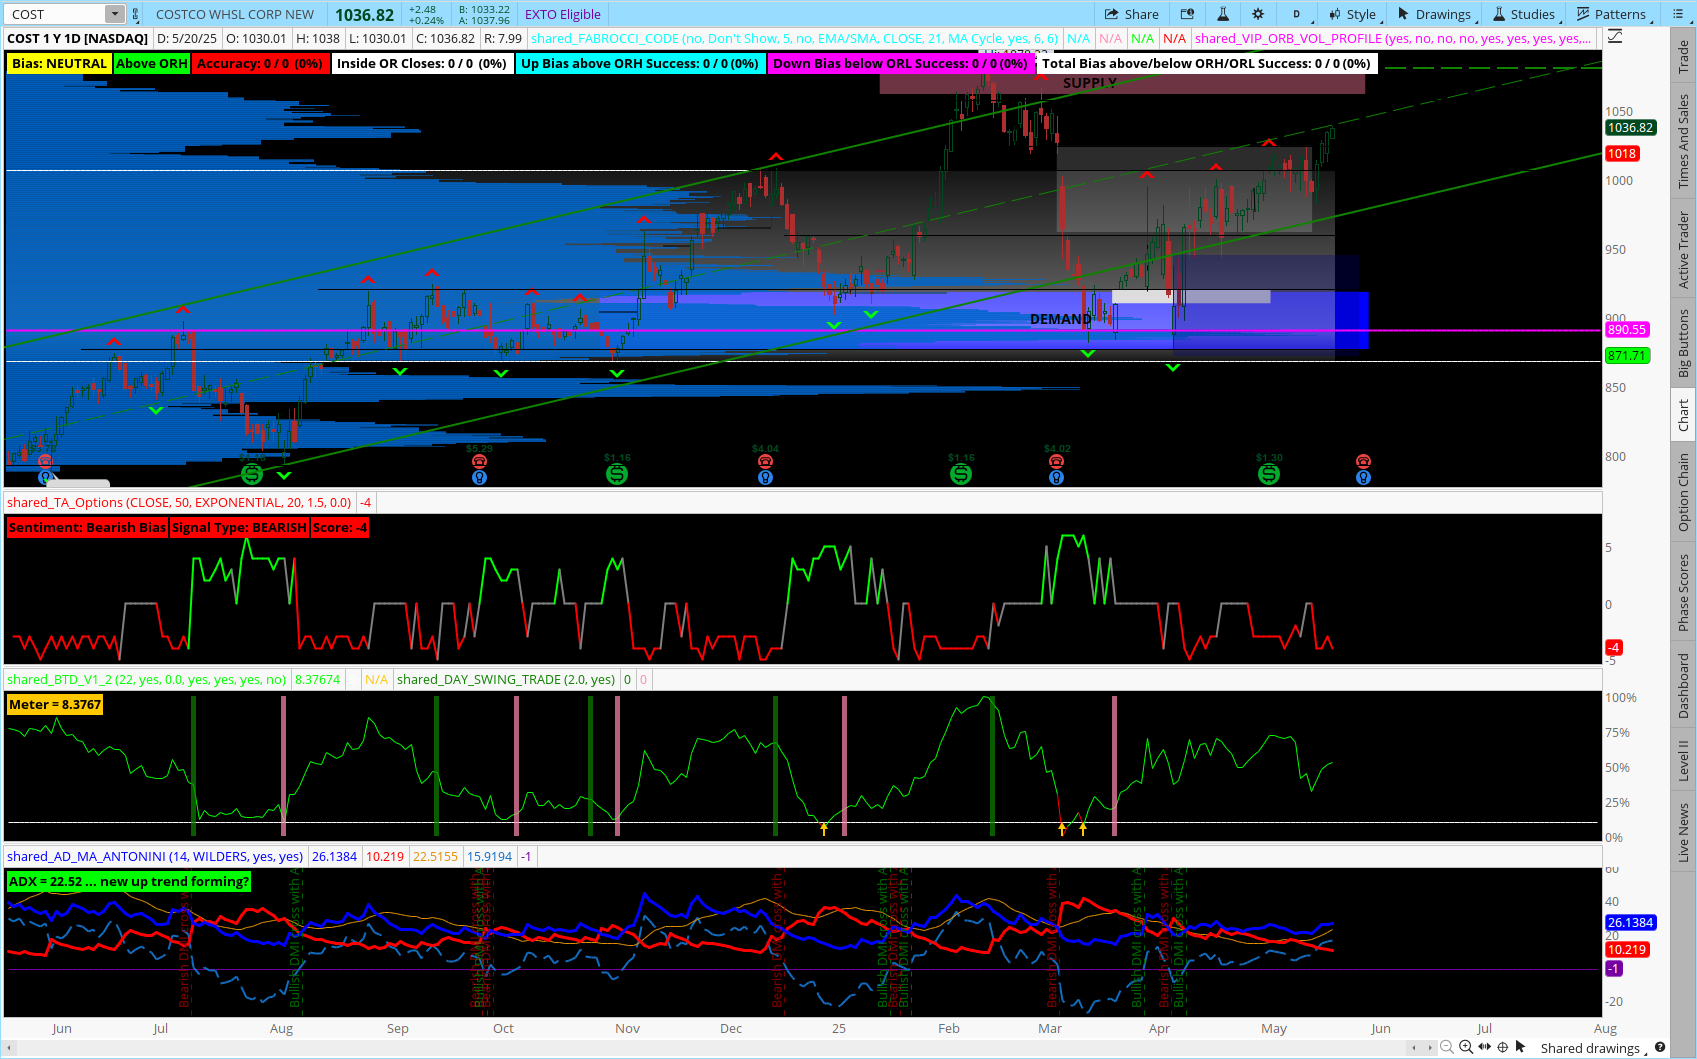
VIP Trading Potential Score
antwerks said:As requested putting over here for you guys to try out - I have a newer version that I combined the BTD and this script so that the BTD would have some exits signals too. This so far has been a money maker but it looks better for longer plays from 20-60 days out and closing 14-22 days into the trade.
OK I was not seeing any great correlations at least not consistently - so my suggestion is to clarify for one a bullish and bearish visual with thermal. Adding labels that reveal score and sentiment based of the criteria. (grey is neutral) - Scaling in table below. I altered the code some clarifying intent by focusing on momentum, price extremes, and volatility all while keeping true to the criteria.
Read more
https://usethinkscript.com/threads/vip-trading-potential-score.21060/
 Unlock Thread
Join our VIP Members Club to get access to our premium indicators including Buy The Dip, Advanced Market Moves and Take Profit.
Your VIP membership includes:
✓Full access to public & private forums
✓No Ads
✓Priority community support
✓Unlimited Postings
✓Premium thinkorswim indicators
✓Exclusive strategies, scanners, add-ons
✓Discord chatroom with Trade Alerts
VIP Membership
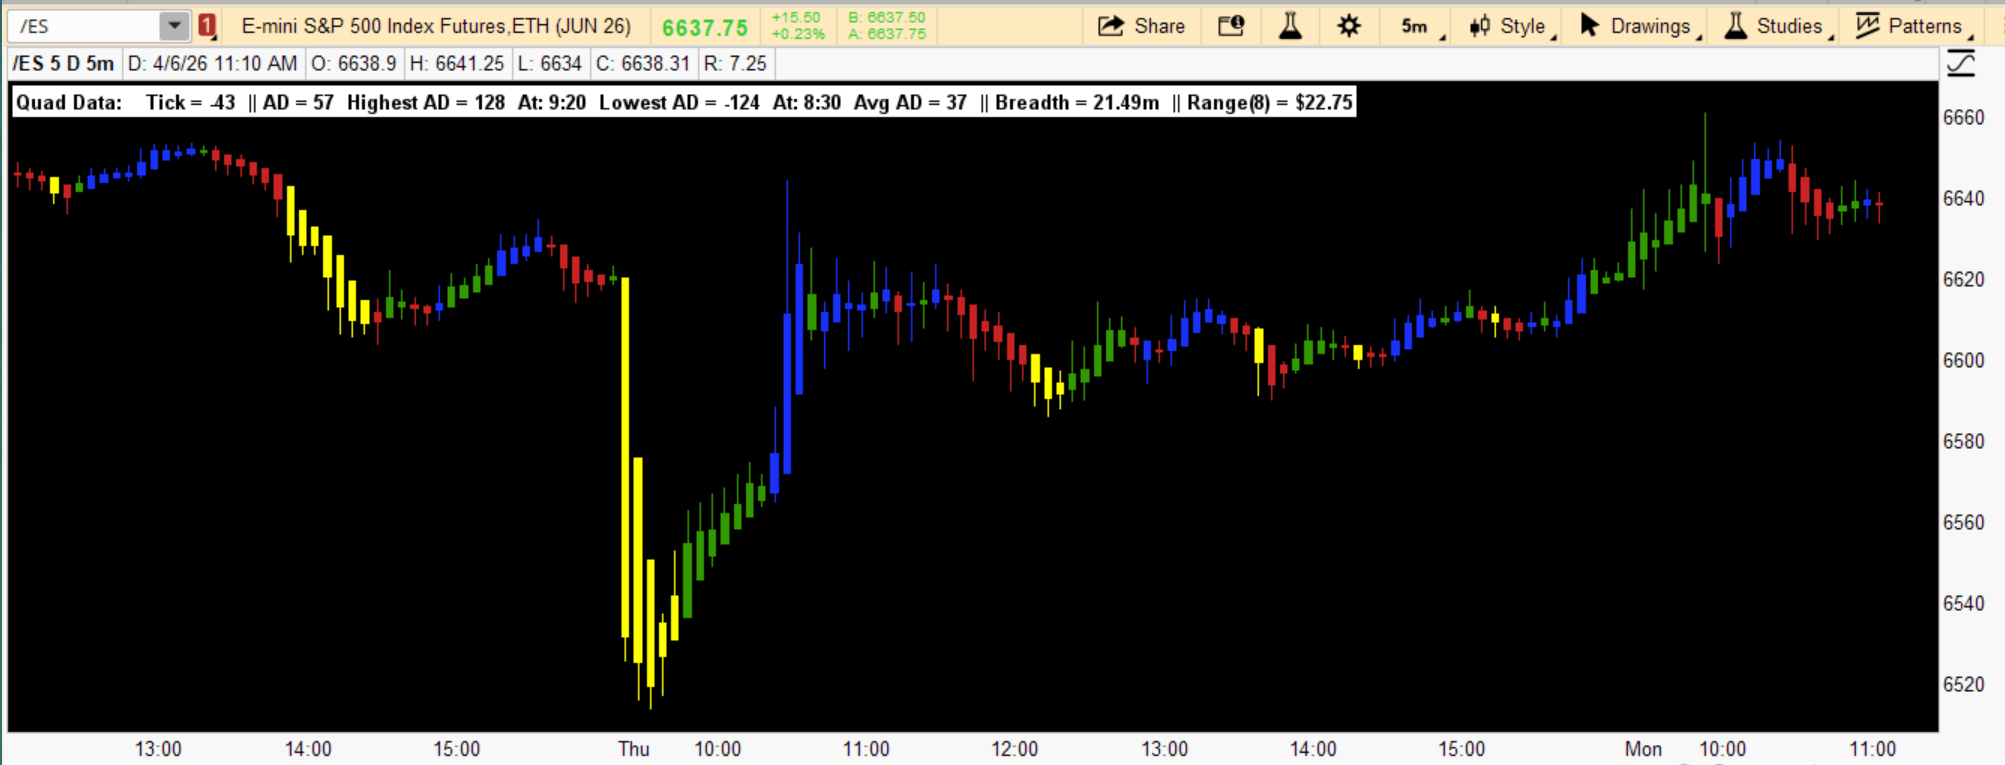
Market Internals: Quad Momentum Intraday
BbenSD said:This Study is for intraday trading only. The study uses Consolidated TICK, Advance Decline, Volume Breadth and Price for Trend Momentum.
When all 4 agree the study plots a directional marker and colors the candles blue for ascending or yellow for descending price. The markers and candle color can be turned on and off with user inputs.
The "n" input is for momentum length calculations. Trading Note:
Look for the candle color or trend marker to "stop plotting" for indication trend may be slowing, possibly changing.
Highest and best use is with a pivot study and a multiple contract Risk On / Risk off money management approach.
Read more
https://usethinkscript.com/threads/market-internals-quad-momentum-intraday-for-thinkorswim.21041/
FROM THE ARCHIVES |
RD Key Levels (Weekly, Daily, Previous vWAP)
Grroov said:The RexDog Key Levels indicator plots the weekly open, daily open, and the previous day vWAP close.
These are all critical price levels (zones) to know when trading any market or instrument. These areas are also high probability reaction areas that you can trade using simple confirmation trading patterns.
Each one of these levels are important levels markets look use for continuation or failure of momentum and bias. I also find it extremely helpful to think of these levels as magnets, dual magnets. They both attract and repel price at the same time. Now you might say, how is that helpful to have opposing views at the same time? Be indifferent to direction, create your own rules on when these price zones repel or attract price, I have my own.
Read more
https://usethinkscript.com/threads/rd-key-levels-weekly-daily-previous-vwap-for-thinkorswim.15095/
Last edited:

