#ema20_xup_dip
#
https://usethinkscript.com/threads/20-ema-break-retrace-scan.18806/
#20 EMA break retrace scan
#jo40788 5/22
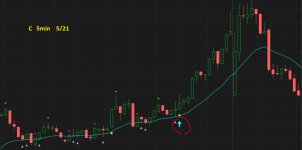
#i was wondering if there was a way to script the following setup on the 20 EMA. I am looking for candles that break the 20 then ride higher with a retrace to the 20 but do not break it. On the move higher it breaks above those highs from when it crossed. I am trying to find a way to scan where it breaks a previous high from when it crossed over the 20 day emea. Thanks
#-----------------------
#sequence of events,
#1. close crosses above ema20
#2. find a peak and save the high. (peakline)
#3. retrace , low drops below ema and the close stays above the ema. (have a 2nd code line to compare body bottom)
#4. look for close crossing above the peakline price.
# buy = all rules happen in seq
#-----------------------
def na = double.nan;
def bn = barnumber();
def data = close;
def lastbn = HighestAll(if IsNaN(close) then 0 else bn);
def lastbar = bn == lastbn;
#def lastbar = (!isnan(close) and isnan(close[-1]));
#input bar_limit = 20;
#input retrace_near_per = 0.2;
def bodytop = max(open,close);
def bodybot = min(open,close);
#---------------------------------------
input avg1_type = AverageType.exponential;
#input avg1_type = AverageType.Simple;
input avg1_length = 20;
def avg1 = MovingAverage(avg1_type, data, avg1_length );
def xup = close crosses above avg1;
def xdwn = close crosses below avg1;
#---------------------------------------
# peaks
#peaksvalleys_robert_03_updated
#
https://usethinkscript.com/threads/...y-demand-zones-for-thinkorswim.172/#post-7048
#post10 robert payne
def highx = high;
def lowx = low;
input length = 4;
def offset = Min(length - 1, lastbn - bn);
def peak = highx > Highest(highx[1], length - 1) and highx == GetValue(Highest(highx, length), -offset);
def valley = lowx < Lowest(lowx[1], length - 1) and lowx == GetValue(Lowest(lowx, length), -offset);
def peakline = if bn == 1 then 0 else if peak then high else peakline[1];
#---------------------------------------
# retrace , (drop to near ema) , lower wick crosses ema and close > ema
#def retrace = if low < avg1 and bodybot > avg1 then 1 else 0;
def retrace = if low < avg1 and close > avg1 then 1 else 0;
#---------------------------------------
# close crosses above peak line
def abovepeakline = close crosses above peakline;
#---------------------------------------
# save the barnumbers of signals
def r1 = xup;
def r1bn = if bn == 1 then 0 else if r1 then bn else r1bn[1];
#---------------------------------------
def r2 = peak;
def r2bn = if bn == 1 then 0 else if r2 then bn else r2bn[1];
#---------------------------------------
def r3 = retrace;
def r3bn = if bn == 1 then 0 else if r3 then bn else r3bn[1];
#---------------------------------------
def r4 = abovepeakline;
def r4bn = if bn == 1 then 0 else if r4 then bn else r4bn[1];
#---------------------------------------
# are the signals in sequence? bn's will be in order
def rulesseq = r1bn < r2bn and r2bn < r3bn and r3bn < r4bn;
#---------------------------------------
# for a scan study, use this
plot buy = r4 and rulesseq;