2 Period ROC with LBR 310 creating DOTS

HushPuppy

New member
@BenTen Good day could you assist me in coding this Linda Raschke indicator in TOS:

Indicator: 2 Period ROC with LBR 310 creating DOTS

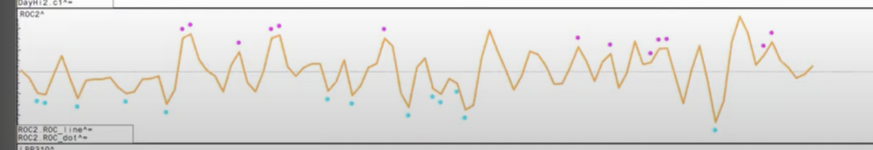
Indicator Process: The line is the 2 period ROC. The dots are generated as follows - If the slope of the LBR 3/10 slow line, fast line, and the ROC are up, then you get a pink dot at the top of the ROC- If all three slopes are down, you get the blue dot at the bottom of the ROC line

** Note: The LBR 3/10 is Linda's Raschke oscillator. The fast line is just the SMA 3 minus the SMA 10. The slow line is the 16-period average of the fast line.

That should be everything you need to recreate it ! -- Attached is how this indicator should look:

Any help would be greatly appreciated.
Thanks
 

Attachments

  • Screenshot 2024-03-08 at 10.39.06 PM.png
    Screenshot 2024-03-08 at 10.39.06 PM.png
    332.8 KB · Views: 105
Solution
this plots the LBR Osc
Code:
declare lower;

input price = close;

def ROC = if price[2] != 0 then (price / price[2] - 1) * 100 else 0;
plot ZeroLine = 0;
input calculationMode = {default Normal, Alternate};

plot FastLine;
switch (calculationMode) {
case Normal:
    FastLine = Average(price, 3) - Average(price, 10);
case Alternate:
    FastLine = Average(price - Average(price[3], 3), 2);
}
plot SlowLine = Average(FastLine, 16);
Def Con1 = if ROC >= ROC[1] then 1 else if ROC < ROC[1] then -1 else 0;
Def Con2 = If Fastline >= Fastline[1] then 1 else if Fastline < Fastline[1] then -1 else 0;
Def Con3 = If Slowline >= Slowline[1] then 1 else if Slowline < Slowline[1] then -1 else 0;
Plot Dots = If (Con1 + Con2 + Con3) == 3 then Fastline +1...
this plots the LBR Osc
Code:
declare lower;

input price = close;

def ROC = if price[2] != 0 then (price / price[2] - 1) * 100 else 0;
plot ZeroLine = 0;
input calculationMode = {default Normal, Alternate};

plot FastLine;
switch (calculationMode) {
case Normal:
    FastLine = Average(price, 3) - Average(price, 10);
case Alternate:
    FastLine = Average(price - Average(price[3], 3), 2);
}
plot SlowLine = Average(FastLine, 16);
Def Con1 = if ROC >= ROC[1] then 1 else if ROC < ROC[1] then -1 else 0;
Def Con2 = If Fastline >= Fastline[1] then 1 else if Fastline < Fastline[1] then -1 else 0;
Def Con3 = If Slowline >= Slowline[1] then 1 else if Slowline < Slowline[1] then -1 else 0;
Plot Dots = If (Con1 + Con2 + Con3) == 3 then Fastline +1 else if (Con1 + Con2 + Con3) == -3 then Fastline -1 else Double.Nan;
Dots.AssignValueColor(if (Con1 + Con2 + Con3) == 3 then Color.Magenta else if (Con1 + Con2 + Con3) == -3 then Color.Cyan else Color.Black);
Dots.SetPaintingStrategy(PaintingStrategy.Points);
Dots.setLineWeight(2);

plot Hist = FastLine;

FastLine.SetDefaultColor(Color.Cyan);
SlowLine.SetDefaultColor(Color.Yellow);
FastLine.SetLineWeight(2);
SlowLine.SetLineWeight(2);
Hist.DefineColor("Positiveup", Color.Green);
Hist.DefineColor("NegativeUp", Color.Light_Red);
Hist.DefineColor("PositiveDown", Color.DarK_Green);
Hist.DefineColor("NegativeDown", Color.Dark_Red);

Hist.AssignValueColor(if Hist >= 0 && Hist >= Hist[1] then Color.Green else if Hist >= 0 && Hist < Hist[1] then Color.Dark_Green else if Hist < 0 && Hist < Hist[1] then Color.Dark_Red else if Hist < 0 && Hist >= Hist[1] then Color.Light_Red else Color.Black);
Hist.SetPaintingStrategy(PaintingStrategy.HISTOGRAM);
Hist.HideTitle();
ZeroLine.SetDefaultColor(Color.Gray);
 
Last edited:
Solution
this plots the ROC

Code:
declare lower;

input price = close;

Plot ROC = if price[2] != 0 then (price / price[2] - 1) * 100 else 0;
plot ZeroLine = 0;
input calculationMode = {default Normal, Alternate};

def FastLine;
switch (calculationMode) {
case Normal:
    FastLine = Average(price, 3) - Average(price, 10);
case Alternate:
    FastLine = Average(price - Average(price[3], 3), 2);
}
Def SlowLine = Average(FastLine, 16);
Def Con1 = if ROC >= ROC[1] then 1 else if ROC < ROC[1] then -1 else 0;
Def Con2 = If Fastline >= Fastline[1] then 1 else if Fastline < Fastline[1] then -1 else 0;
Def Con3 = If Slowline >= Slowline[1] then 1 else if Slowline < Slowline[1] then -1 else 0;
Plot Dots = If (Con1 + Con2 + Con3) == 3 then ROC +1 else if (Con1 + Con2 + Con3) == -3 then ROC -1 else Double.Nan;
Dots.AssignValueColor(if (Con1 + Con2 + Con3) == 3 then Color.Magenta else if (Con1 + Con2 + Con3) == -3 then Color.Cyan else Color.Black);
Dots.SetPaintingStrategy(PaintingStrategy.Points);
Dots.setLineWeight(2);

plot Hist = ROC;

ROC.SetDefaultColor(Color.Cyan);

ROC.SetLineWeight(2);


Hist.AssignValueColor(if Hist >= 0 && Hist >= Hist[1] then Color.Green else if Hist >= 0 && Hist < Hist[1] then Color.Dark_Green else if Hist < 0 && Hist < Hist[1] then Color.Dark_Red else if Hist < 0 && Hist >= Hist[1] then Color.Light_Red else Color.Black);
Hist.SetPaintingStrategy(PaintingStrategy.HISTOGRAM);
Hist.HideTitle();
ZeroLine.SetDefaultColor(Color.Gray);
 
@henry1224 Thank you sooo much for your help on these 2 indicators. Is there any way I can have the ROC2 DOTs show on the chart as well when needed? Also what parameter controls how close or far off the candle the Dots sit?
  • I tried moving the study up but the DOTS were way off from the candle.
  • Then I tried changing the " declare lower " to "declare Upper" but that just made the dots disappear completely. Ahhh - Any help or guidance would be greatly appreciated.

Kind Thanks,
Hush
 
Last edited:
@henry1224 Thank you sooo much for your help on these 2 indicators. Is there any way I can have the ROC2 DOTs show on the chart as well when needed? Also what parameter controls how close or far off the candle the Dots sit?
  • I tried moving the study up but the DOTS were way off from the candle.
  • Then I tried changing the " declare lower " to "declare Upper" but that just made the dots disappear completely. Ahhh - Any help or guidance would be greatly appreciated.

Kind Thanks,
Hush
to plot the dots on top of price you first need


Code:
declare upper;

input price = close;

def ROC = if price[2] != 0 then (price / price[2] - 1) * 100 else 0;
def ZeroLine = 0;
input calculationMode = {default Normal, Alternate};

def FastLine;
switch (calculationMode) {
case Normal:
    FastLine = Average(price, 3) - Average(price, 10);
case Alternate:
    FastLine = Average(price - Average(price[3], 3), 2);
}
Def SlowLine = Average(FastLine, 16);
Def Con1 = if ROC >= ROC[1] then 1 else if ROC < ROC[1] then -1 else 0;
Def Con2 = If Fastline >= Fastline[1] then 1 else if Fastline < Fastline[1] then -1 else 0;
Def Con3 = If Slowline >= Slowline[1] then 1 else if Slowline < Slowline[1] then -1 else 0;
Plot Dots = If (Con1 + Con2 + Con3) == 3 then High +1 else if (Con1 + Con2 + Con3) == -3 then Low -1 else Double.Nan;
Dots.AssignValueColor(if (Con1 + Con2 + Con3) == 3 then Color.Magenta else if (Con1 + Con2 + Con3) == -3 then Color.Cyan else Color.Black);
Dots.SetPaintingStrategy(PaintingStrategy.Points);
Dots.setLineWeight(2);
per
 

Join useThinkScript to post your question to a community of 21,000+ developers and traders.

Similar threads

Not the exact question you're looking for?

Start a new thread and receive assistance from our community.

87k+ Posts
354 Online
Create Post

Similar threads

Similar threads

The Market Trading Game Changer

Join 2,500+ subscribers inside the useThinkScript VIP Membership Club
  • Exclusive indicators
  • Proven strategies & setups
  • Private Discord community
  • ‘Buy The Dip’ signal alerts
  • Exclusive members-only content
  • Add-ons and resources
  • 1 full year of unlimited support

Frequently Asked Questions

What is useThinkScript?

useThinkScript is the #1 community of stock market investors using indicators and other tools to power their trading strategies. Traders of all skill levels use our forums to learn about scripting and indicators, help each other, and discover new ways to gain an edge in the markets.

How do I get started?

We get it. Our forum can be intimidating, if not overwhelming. With thousands of topics, tens of thousands of posts, our community has created an incredibly deep knowledge base for stock traders. No one can ever exhaust every resource provided on our site.

If you are new, or just looking for guidance, here are some helpful links to get you started.

What are the benefits of VIP Membership?
VIP members get exclusive access to these proven and tested premium indicators: Buy the Dip, Advanced Market Moves 2.0, Take Profit, and Volatility Trading Range. In addition, VIP members get access to over 50 VIP-only custom indicators, add-ons, and strategies, private VIP-only forums, private Discord channel to discuss trades and strategies in real-time, customer support, trade alerts, and much more. Learn all about VIP membership here.
How can I access the premium indicators?
To access the premium indicators, which are plug and play ready, sign up for VIP membership here.
Back
Top