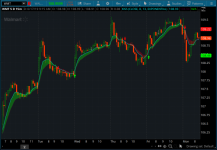
Moving Average Crossovers For ThinkOrSwim

BenTen

Administrative
Staff member
Staff
VIP
Lifetime
This is just a simple indicator for moving average crossover but added scanner, cloud, and alerts for additional visual effect and enhancement.

For example, if 5/10 EMA crossover is your strategy, then this indicator plot an up arrow on the golden cross and down arrow on the death cross. You can also use the scanner to scan for stocks with EMA crossover and the built-in alerts to let you know as it happens.

1XlzIJA.png


thinkScript Code

Rich (BB code):
# Moving Average Crossover With Arrows, Alerts, Crossing Count and Bubble at Cross
# Mobius
# Chat Room Request 01.25.2017
# Modified a bit by BenTen

input price = close;
input fastLength = 8;
input slowLength = 21;
input averageType = AverageType.EXPONENTIAL;

plot FastMA = MovingAverage(averageType, price, fastLength);
plot SlowMA = MovingAverage(averageType, price, slowLength);
FastMA.SetDefaultColor(GetColor(1));
SlowMA.SetDefaultColor(GetColor(2));

plot ArrowUp = if FastMA crosses above SlowMA
               then low
               else double.nan;
     ArrowUP.SetPaintingStrategy(PaintingStrategy.Arrow_UP);
     ArrowUP.SetLineWeight(3);
     ArrowUP.SetDefaultColor(Color.Green);
plot ArrowDN = if FastMA crosses below SlowMA
               then high
               else double.nan;
     ArrowDN.SetPaintingStrategy(PaintingStrategy.Arrow_DOWN);
     ArrowDN.SetLineWeight(3);
     ArrowDN.SetDefaultColor(Color.Red);
Alert(ArrowUp, " ", Alert.Bar, Sound.Chimes);
Alert(ArrowDN, " ", Alert.Bar, Sound.Bell);

DefineGlobalColor("Bullish", color.green); 
DefineGlobalColor("Bearish", color.red); 
input seeClouds = yes ;
AddCloud(if(seeClouds,FastMA,double.NaN), SlowMA, GlobalColor("Bullish"), GlobalColor("Bearish"));
# End Code

Shareable Link

https://tos.mx/2ZED6i
 

Attachments

  • 1XlzIJA.png
    1XlzIJA.png
    173.6 KB · Views: 1,155
Last edited by a moderator:
Thanks @BenTen

Using this for the 9EMA crossing 20SMA as signal for possibly entry/exit. Although I dont see Bubble at Cross. Show Bubble is enabled.

Code:
# Moving Average Crossover With Arrows, Alerts, Crossing Count and Bubble at Cross
# Mobius
# Chat Room Request 01.25.2017
# Modified a bit by BenTen

input price = close;
input fastLength = 9;
input slowLength = 20;
input averageType = AverageType.EXPONENTIAL;
input averageType2 = AverageType.SIMPLE;

plot FastMA = MovingAverage(averageType, price, fastLength);
plot SlowMA = MovingAverage(averageType2, price, slowLength);
FastMA.SetDefaultColor(GetColor(1));
SlowMA.SetDefaultColor(GetColor(2));

plot ArrowUp = if FastMA crosses above SlowMA
               then low
               else double.nan;
     ArrowUP.SetPaintingStrategy(PaintingStrategy.Arrow_UP);
     ArrowUP.SetLineWeight(3);
     ArrowUP.SetDefaultColor(Color.Green);
plot ArrowDN = if FastMA crosses below SlowMA
               then high
               else double.nan;
     ArrowDN.SetPaintingStrategy(PaintingStrategy.Arrow_DOWN);
     ArrowDN.SetLineWeight(3);
     ArrowDN.SetDefaultColor(Color.Red);
Alert(ArrowUp, " ", Alert.Bar, Sound.Chimes);
Alert(ArrowDN, " ", Alert.Bar, Sound.Bell);

AddCloud(FastMA, SlowMA, Color.GREEN, Color.RED);
# End Code
 
@jay2 - If you read the notes in the study @BenTen posted, he mentioned he modified the study slightly.

Here is the original version of Mobius study configured with the 9/20 EMA using your desired periods. It does have bubbles but only for the very last cross

Code:
# Moving Average Crossover With Arrows, Alerts, Crossing Count and Bubble at Cross and trend colors
# Mobius
# Chat Room Request 01.25.2017

input price = close;
input fastLength = 9;
input slowLength = 20;
input averageType = AverageType.EXPONENTIAL;

plot FastMA = MovingAverage(averageType, price, fastLength);
plot SlowMA = MovingAverage(averageType, price, slowLength);
FastMA.AssignValueColor(if FastMA > SlowMA then color.green else color.red);
SlowMA.AssignValueColor(if FastMA > SlowMA then color.green else color.red);

plot ArrowUp = if FastMA crosses above SlowMA
               then low
               else double.nan;
     ArrowUP.SetPaintingStrategy(PaintingStrategy.Arrow_UP);
     ArrowUP.SetLineWeight(3);
     ArrowUP.SetDefaultColor(Color.Green);
plot ArrowDN = if FastMA crosses below SlowMA
               then high
               else double.nan;
     ArrowDN.SetPaintingStrategy(PaintingStrategy.Arrow_DOWN);
     ArrowDN.SetLineWeight(3);
     ArrowDN.SetDefaultColor(Color.Red);
Alert(ArrowUp, " ", Alert.Bar, Sound.Chimes);
Alert(ArrowDN, " ", Alert.Bar, Sound.Bell);
def countUP = if FastMA crosses above SlowMA
              then 1
              else if FastMA > SlowMA
                   then countUP[1] + 1
              else if ArrowDN
                   then 0
                   else countUP[1];
AddLabel(1, "Count UP = " + countUP, color.white);
def CrossBar = if FastMA crosses SlowMa
               then barNumber()
               else double.nan;
AddChartBubble(barNumber() == HighestAll(CrossBar), FastMA, "Cross", color.cyan);
# End Code
 
I have been looking for MA's to combine with other indicators. Here is another version, just a little differant. You can use it also as a entry for the Super Trend or Reversal Trend to get in on a trade between Reversal candles.

As you can see Im not a photo editor lol...
Code only for MA's you can adjust to your setting easy.

Code:
#hint: <b>Find Moving Average Xover</b>\nFinds when a fast moving average crosses over or under a slow.\n The fast average going above the slow average (bullish crossover) is a signal to buy, while the opposite situation (bearish crossover) is a signal to sell.

input price = close;#hint price: The price used to calculate the crossover. <b>(Default is CLOSE)</b>
input fastLength = 3;#hint fastLength: The number of bars used to calculate the fast moving average. <b>(Default is 3)</b>
input slowLength = 8;#hint slowLength: The number of bars used to calculate the slow moving average. <b>(Default is 8)</b>
input slowAvgType = {default Simple, Exponential, Weighted, Wilders, Hull};#hint slowAvgType: Type of the fast moving average to be used for calculation. <b>(Default is Expontential)</b>
input fastAvgType = {default Simple, Exponential, Weighted, Wilders, Hull};#hint fastAvgType: Type of the fast moving average to be used for calculation. <b>(Default is Exponential)</b>
Input DoArrows = no;#hint DoArrows:Yes shows arrows to define crosses
Input DoPlots = yes;#hint DoPlots: Yes shows MA plots to define crosses. Default is 'YES'
Input DoAlerts = No;#hint DoAlerts:No turns off alerts

Assert( fastLength < slowLength, "fastLength ["+fastLength+"] must be less than slowLength["+slowLength+"]");

def fastAvg;
switch (slowAvgType) {
  case Simple:
    fastAvg = Average(price, fastLength);
  case Exponential:
    fastAvg = ExpAverage(price, fastLength);
  case Weighted:
    fastAvg = wma(price, fastLength);
  case Wilders:
    fastAvg = WildersAverage(price, fastLength);
  case Hull:
    fastAvg = HullMovingAvg(price, fastLength);
}

def slowAvg;
switch (fastAvgType) {
  case Simple:
    slowAvg = Average(price, slowLength);
  case Exponential:
    slowAvg = ExpAverage(price, slowLength);
  case Weighted:
    slowAvg = wma(price, slowLength);
  case Wilders:
    slowAvg = WildersAverage(price, slowLength);
  case Hull:
    slowAvg = HullMovingAvg(price, slowLength);
}

plot signalXup = If DoArrows Then crosses(fastAvg, slowAvg, CrossingDirection.above) else Double.nan;

signalXup.SetDefaultColor(Color.pink);
signalXup.SetPaintingStrategy(PaintingStrategy.BOOLEAN_ARROW_UP);
signalXup.SetLineWeight(3);
plot signalXdn =  If DoArrows Then crosses(fastAvg, slowAvg, CrossingDirection.below) else Double.nan;

signalXdn.SetDefaultColor(Color.Green);
signalXdn.SetPaintingStrategy(PaintingStrategy.BOOLEAN_ARROW_DOWN);
signalXdn.SetLineWeight(3);

Alert(signalXup && DoAlerts, "UP...Fast MA Cross Above Slow MA", Alert.BAR, Sound.Ring );
Alert(signalXdn && DoAlerts, "Down...Fast Ma Cross Below Slow MA", Alert.BAR, Sound.Bell );

Plot fast_Avg = If DoPlots  then Fastavg else double.nan;
fast_Avg.SetDefaultColor(Color.pink);
fast_Avg.SetPaintingStrategy(PaintingStrategy.line);
fast_Avg.SetLineWeight(2);

Plot Slo_Avg = If DoPlots  then Slowavg else double.nan;
Slo_Avg.SetDefaultColor(Color.cyan);
Slo_Avg.SetPaintingStrategy(PaintingStrategy.line);
Slo_Avg.SetLineWeight(2);

AddCloud(fastAvg, slowAvg, color.green, color.red);
AddLabel(1, "Fast MA(" + fastLength + ")",color.pink);
AddLabel(1, "Slow MA(" + slowLength + ")",color.cyan);
 
Last edited by a moderator:
HI guys, great work here.

Can anyone help me with weekly moving average Cross overs. I don't know why weekly moving average crossovers return no results in my scan. As soon as i change it to lower time frames from daily downward, I get plenty results. I thought there just wasn't any right this moment (1/6/2020), but when I checked manually, I see there are plenty crossovers of the 2 day / 200SMA as well as price going above and below 200SMA.

So clearly TOS just doesn't give me results for some reason. Can you help? Maybe there is already a thread here, which I just haven't seen.

MA
WPB, FL
@rive7579 Put the code from #3 above into TOS Studies. That code will give you what you want. It should put the MA's on your chart, just set them for your 2 crossing parameters. You should confirm on the chart first that there is a weekly crossover - then scan for it to be sure it comes up. Please start with S&P100 to narrow your range and get the study dialed in.
Markos
Welcome to our great community!
 
Not sure if I'm in the right forum Ive been playing with the ma cross and beleive to be a very very useful script. I'm using this as an alert to show the 8/15, 15/49 cross overs.
Code:
# tomsk
# 1.5.2020
input price = close;
input length1 = 8;
input length2 = 20;
def MA1 = Average(price, length1);
def MA2 = Average(price, length2);
AddLabel(1, "Moving Average " + length1 + "/" + length2 + " Cross Direction = " + if MA1 > MA2 then "UP" else "DOWN", if MA1 > MA2 then Color.GREEN else Color.RED);
# End Moving Average Cross Direction Label
 
Last edited by a moderator:
Hey everyone. Hopefully this thread is not dead. In new to this script thing and I’m trying to figure it out. Basically I’m looking to have a scan from think or swim that can pick up when the 15 EMA crosses up and over the 34 EMA. Or values close to that. Are any of this above scripts suitable? How do you receive the alerts? Thank you guys.
 
I am trying to set it up so I can get an alert on my phone when the MovAvgExponential 14 and 21 cross. I can set up other alerts to come to my phone. It looks like you can create a custom alert using code. Below are the settings on the 14 one. Anyone have any idea how to add to the code to make it work?

Code:
# TD Ameritrade IP Company, Inc. (c) 2017-2019
#

input price = close;
input length = 14;
input displace = 0;
input showBreakoutSignals = no;

plot AvgExp = ExpAverage(price[-displace], length);
plot UpSignal = price crosses above AvgExp;
plot DownSignal = price crosses below AvgExp;

UpSignal.SetHiding(!showBreakoutSignals);
DownSignal.SetHiding(!showBreakoutSignals);

AvgExp.SetDefaultColor(GetColor(1));
UpSignal.SetDefaultColor(Color.UPTICK);
UpSignal.SetPaintingStrategy(PaintingStrategy.BOOLEAN_ARROW_UP);
DownSignal.SetDefaultColor(Color.DOWNTICK);
DownSignal.SetPaintingStrategy(PaintingStrategy.BOOLEAN_ARROW_DOWN);
 
@lzstock Don't think you can get alerted through text for this. Take a look at the first post in this thread. The script already includes alerts. But the chart has to be loaded on your screen in order to hear the alert sound. Also, you can create a scanner for the crossover and get alerted through the ToS mobile app.
 
With the level of knowledge on this site, I am expecting that this is a simple request but a coder, I am not. Can anyone give me an indy that shows a buy or sell arrow on my chart when the 8 EMA and the 3 EMA cross? I'd like to still be able to change the color of the EMA line. Any takers?
 
This should work for you (with alerts):

Code:
input FastLength = 3;
input SlowLength = 8;
input averageType = AverageType.EXPONENTIAL;

plot Fast = MovingAverage(averageType, close, FastLength);
plot Slow = MovingAverage(averageType, close, SlowLength);

def CrossAbove = Fast > Slow
    and Fast[1] <= Slow[1];

def CrossBelow = Fast < Slow
    and Fast[1] >= Slow[1];

plot ArrowUp = CrossAbove;
ArrowUp.SetPaintingStrategy(PaintingStrategy.BOOLEAN_ARROW_UP);
ArrowUp.SetDefaultColor(Color.GREEN);

plot ArrowDown = CrossBelow;
ArrowDown.SetPaintingStrategy(PaintingStrategy.BOOLEAN_ARROW_DOWN);
ArrowDown.SetDefaultColor(Color.RED);


Alert(CrossAbove, "CrossAbove", Alert.BAR, Sound.RING);
Alert(CrossBelow, "CrossBelow", Alert.BAR, Sound.RING);
 
Any script that change the line color on EMAs when the trend change up or down, sample UP green line, DW red line , thanks
 
Is it possible someone can help make a Moving Average that will have alerts in it with the breakout signals. For example, the MovAvgExponential Indicator doesn't have a section to turn on Alerts :( .
 
@toopoor88 Sorry totally forgot about your request. Here is the code.

Code:
#
# TD Ameritrade IP Company, Inc. (c) 2017-2020
#

input price = close;
input length = 9;
input displace = 0;
input showBreakoutSignals = yes;

plot AvgExp = ExpAverage(price[-displace], length);
plot UpSignal = price crosses above AvgExp;
plot DownSignal = price crosses below AvgExp;

UpSignal.SetHiding(!showBreakoutSignals);
DownSignal.SetHiding(!showBreakoutSignals);

AvgExp.SetDefaultColor(GetColor(1));
UpSignal.SetDefaultColor(Color.UPTICK);
UpSignal.SetPaintingStrategy(PaintingStrategy.BOOLEAN_ARROW_UP);
DownSignal.SetDefaultColor(Color.DOWNTICK);
DownSignal.SetPaintingStrategy(PaintingStrategy.BOOLEAN_ARROW_DOWN);

# Alerts
Alert(UpSignal, " ", Alert.Bar, Sound.Chimes);
Alert(DownSignal, " ", Alert.Bar, Sound.Bell);
 

Join useThinkScript to post your question to a community of 21,000+ developers and traders.

Similar threads

Not the exact question you're looking for?

Start a new thread and receive assistance from our community.

87k+ Posts
367 Online
Create Post

Similar threads

Similar threads

The Market Trading Game Changer

Join 2,500+ subscribers inside the useThinkScript VIP Membership Club
  • Exclusive indicators
  • Proven strategies & setups
  • Private Discord community
  • ‘Buy The Dip’ signal alerts
  • Exclusive members-only content
  • Add-ons and resources
  • 1 full year of unlimited support

Frequently Asked Questions

What is useThinkScript?

useThinkScript is the #1 community of stock market investors using indicators and other tools to power their trading strategies. Traders of all skill levels use our forums to learn about scripting and indicators, help each other, and discover new ways to gain an edge in the markets.

How do I get started?

We get it. Our forum can be intimidating, if not overwhelming. With thousands of topics, tens of thousands of posts, our community has created an incredibly deep knowledge base for stock traders. No one can ever exhaust every resource provided on our site.

If you are new, or just looking for guidance, here are some helpful links to get you started.

What are the benefits of VIP Membership?
VIP members get exclusive access to these proven and tested premium indicators: Buy the Dip, Advanced Market Moves 2.0, Take Profit, and Volatility Trading Range. In addition, VIP members get access to over 50 VIP-only custom indicators, add-ons, and strategies, private VIP-only forums, private Discord channel to discuss trades and strategies in real-time, customer support, trade alerts, and much more. Learn all about VIP membership here.
How can I access the premium indicators?
To access the premium indicators, which are plug and play ready, sign up for VIP membership here.
Back
Top