I would like to create an indicator that uses a triangular moving average. Here is the hard part. I would like to shift the highest weight forward or back over the length of the moving average. I could have the weight all the way forward on the current bar, near the current bar, nearly back to the oldest data in the sampled period, or on the bar that will be dropped off next. The slope from the highest weighted bar to each end would be linear. Each end of the sample would always have the lowest weight unless the weight was shifted to the first or the last bar of the moving average length. Can this be done? I am most interested in learning how this could be coded in ThinkSript.
I would like to create an indicator that uses a triangular moving average. Here is the hard part. I would like to shift the highest weight forward or back over the length of the moving average. I could have the weight all the way forward on the current bar, near the current bar, nearly back to the oldest data in the sampled period, or on the bar that will be dropped off next. The slope from the highest weighted bar to each end would be linear. Each end of the sample would always have the lowest weight unless the weight was shifted to the first or the last bar of the moving average length. Can this be done? I am most interested in learning how this could be coded in ThinkSript.
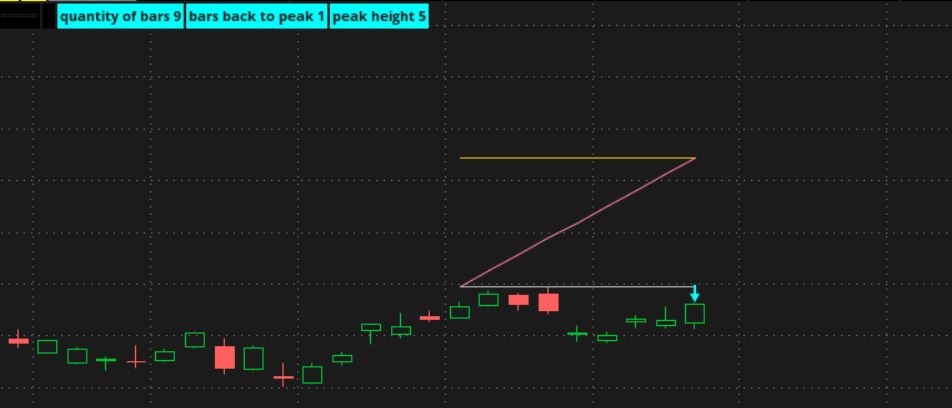
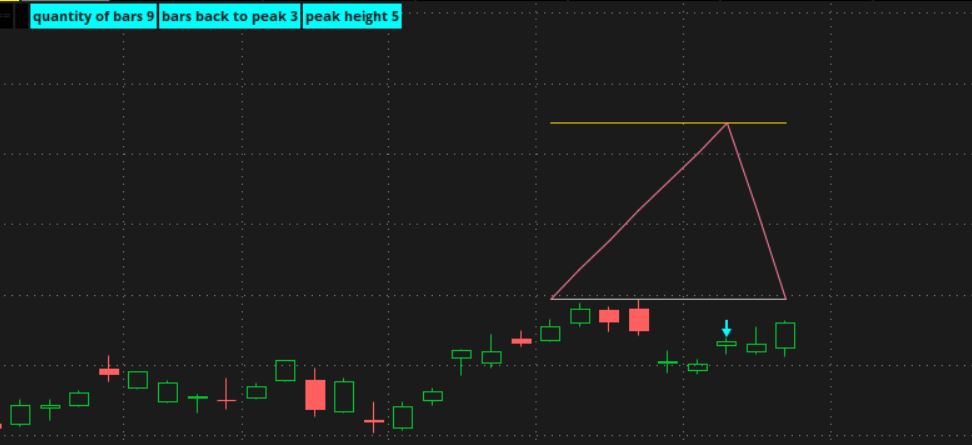
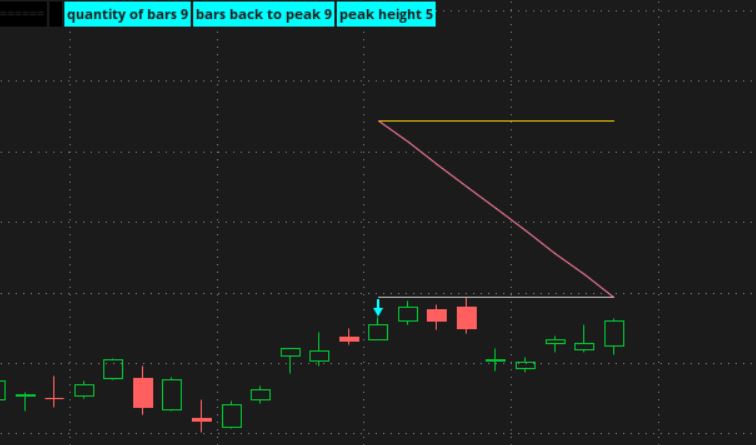
maybe this can be a starting point, for some experimenting.
this draws 1 or 2 lines, as a peak, over the last x bars on the chart.
the line(s) represent the weights.
change this to choose where the peak will be.
input peak_bars_back_from_last_bar = 3;
..if bar qty = 1, then 1 line, that is highest on last bar
..if bar qty = len, then 1 line, that is highest on first bar of len group
..else 2 lines that form a pyramid peak
i don't know what a triangle average is, so no comment on that.
when posting about something different, post a link that describes it, so others don't have to go searching.
This does not look like what I was describing. I might be using the wrong terminology. However, I think I can learn from this example in general even if I am not learning exactly what I originally wanted to learn. Thank you for responding the best you could considering my poor explanation.
The easiest thing to do would be to use the ToS triangular moving average. Though it doesn't allow different weighting, so if you want that specifically you'd have to do something different.
You may also look at the Recursive Moving Average Difference, which accomplishes a lot more than a triangular moving average. It samples a range of moving average lengths and determines trend from changes in the moving averages. It's dynamic, so it's better than simply adding a few averages together.
This does not look like what I was describing. I might be using the wrong terminology. However, I think I can learn from this example in general even if I am not learning exactly what I originally wanted to learn. Thank you for responding the best you could considering my poor explanation.
useThinkScript is the #1 community of stock market investors using indicators and other tools to power their trading strategies. Traders of all skill levels use our forums to learn about scripting and indicators, help each other, and discover new ways to gain an edge in the markets.
How do I get started?
We get it. Our forum can be intimidating, if not overwhelming. With thousands of topics, tens of thousands of posts, our community has created an incredibly deep knowledge base for stock traders. No one can ever exhaust every resource provided on our site.
If you are new, or just looking for guidance, here are some helpful links to get you started.
VIP members get exclusive access to these proven and tested premium indicators: Buy the Dip, Advanced Market Moves 2.0, Take Profit, and Volatility Trading Range. In addition, VIP members get access to over 50 VIP-only custom indicators, add-ons, and strategies, private VIP-only forums, private Discord channel to discuss trades and strategies in real-time, customer support, trade alerts, and much more. Learn all about VIP membership here.
How can I access the premium indicators?
To access the premium indicators, which are plug and play ready, sign up for VIP membership here.