
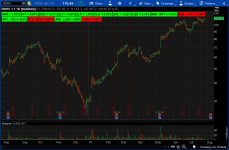
Labels to keep you up to Speed on Market Risk
https://tos.mx/BwwQKR
Code:
# PctComp - Key Risk ETFs
# 01-22-2017
# Chat request by Blackhatter - Dilbert & Spectrum in TSL

def IWMPctChg = (close("IWM", period = "Day") / close("IWM", period = "Day")[1]) - 1;
AddLabel(1, "IWM" + " = " + AsPercent(IWMPctChg), if IWMPctChg > 0 then Color.GREEN else Color.RED);

def SPYPctChg = (close("SPY", period = "Day") / close("SPY", period = "Day")[1]) - 1;
AddLabel(1, "SPY" + " = " + AsPercent(SPYPctChg), if SPYPctChg > 0 then Color.GREEN else Color.RED);

def EEMPctChg = (close("EEM", period = "Day") / close("EEM", period = "Day")[1]) - 1;
AddLabel(1, "EEM" + " = " + AsPercent(EEMPctChg), if EEMPctChg > 0 then Color.GREEN else Color.RED);

def XLYPctChg = (close("XLY", period = "Day") / close("XLY", period = "Day")[1]) - 1;
AddLabel(1, "XLY" + " = " + AsPercent(XLYPctChg), if XLYPctChg > 0 then Color.GREEN else Color.RED);

def XLPPctChg = (close("XLP", period = "Day") / close("XLP", period = "Day")[1]) - 1;
AddLabel(1, "XLP" + " = " + AsPercent(XLPPctChg), if XLPPctChg > 0 then Color.GREEN else Color.RED);

def XLUPctChg = (close("XLU", period = "Day") / close("XLU", period = "Day")[1]) - 1;
AddLabel(1, "XLU" + " = " + AsPercent(XLUPctChg), if XLUPctChg > 0 then Color.GREEN else Color.RED);

def JNKPctChg = (close("JNK", period = "Day") / close("JNK", period = "Day")[1]) - 1;
AddLabel(1, "JNK" + "  = " + AsPercent(JNKPctChg), if JNKPctChg > 0 then Color.GREEN else Color.RED);

def LQDPctChg = (close("LQD", period = "Day") / close("LQD", period = "Day")[1]) - 1;
AddLabel(1, "LQD" + " = " + AsPercent(LQDPctChg), if LQDPctChg > 0 then Color.GREEN else Color.RED);

AddLabel(1, "IWM - SPY = " + AsPercent(IWMPctChg - SPYPctChg), if IWMPctChg - SPYPctChg > 0 then Color.GREEN else Color.RED);
AddLabel(1, "EEM - SPY = " + AsPercent(EEMPctChg - SPYPctChg), if EEMPctChg - SPYPctChg > 0 then Color.GREEN else Color.RED);
AddLabel(1, "SPY - XLU = " + AsPercent(SPYPctChg - XLUPctChg), if SPYPctChg - XLUPctChg > 0 then Color.GREEN else Color.RED);
AddLabel(1, "XLY - XLP = " + AsPercent(XLYPctChg - XLPPctChg), if XLYPctChg - XLPPctChg > 0 then Color.GREEN else Color.RED);
AddLabel(1, "JNK - LQD = " + AsPercent(JNKPctChg - LQDPctChg), if JNKPctChg - LQDPctChg > 0 then Color.GREEN else Color.RED);

AddLabel(1, "Total = " + AsPercent((IWMPctChg - SPYPctChg) + (EEMPctChg - SPYPctChg) + (SPYPctChg - XLUPctChg) + (XLYPctChg - XLPPctChg) + (JNKPctChg - LQDPctChg)), if ((IWMPctChg - SPYPctChg) + (EEMPctChg - SPYPctChg) + (SPYPctChg - XLUPctChg) + (XLYPctChg - XLPPctChg) + (JNKPctChg - LQDPctChg)) > 0 then color.green else color.red);
#EOC#
Attachments
Last edited:
")