-
Happy Father's Day! For a limited time: take $50 off VIP Membership with code DAD50 Claim Discount

You should upgrade or use an alternative browser.
Overlay previous 2 days of data
- Thread starter lance
- Start date
Join useThinkScript to post your question to a community of 21,000+ developers and traders.
You can also build yourself a lower indicator for your markets open/closed using secondsTill() and secondsFrom() if you need.
Happy Trading,
Mashume
SECOND: use the DISPLACE feature in the study to shift it over (you pretty much count how many bars are in each day and set it at that number)
takes a little bit of work but it works. Not sure what its worth to you, but in about 5 mins you should be able to adjust to your liking.
input aggregationPeriod = AggregationPeriod.DAY;
input length = 1;
input displace = -1;
input showOnlyLastPeriod = no;
plot PrevDayClose;
if showOnlyLastPeriod and !IsNaN(close(period = aggregationPeriod)[-1]) { PrevDayClose = Double.NaN;
} else { PrevDayClose = Highest(close(period = aggregationPeriod)[-displace], length);
}Its Price Comparison From Previous Day at the same bar (or same time )and can be adjusted to compare XZY days ago by adjusting the "DaysAgo"
remember to hit the like button if you liked my post!
#Price Comparison From Previous Day at the same bar

input DaysAgo = 1;
def c = close;
def x = BarNumber();
def nan = double.nan;
def RTHbar1 = if getday()<>getday()[Daysago]

              then x
              else RTHbar1[1];

def PrevRTHbar1 = if RTHbar1 != RTHbar1[1]
                  then RTHbar1[1]
                  else PrevRTHbar1[1];
def indexBar = RTHbar1 - PrevRTHbar1;
plot PrevDay = if IsNaN(c)
               then nan
               else GetValue(c, indexBar);
PrevDay.SetPaintingStrategy(PaintingStrategy.LINE);
PrevDay.SetDefaultColor(CreateColor(0, 255, 255));
PrevDay.SetLineWeight(1);
plot Current_Price = c;
Current_Price.SetPaintingStrategy(PaintingStrategy.LINE);
Current_Price.SetDefaultColor(CreateColor(0, 191, 0));
Current_Price.SetLineWeight(1);


AddLabel(1, "Same Bar Comparison from " + DaysAgo + " Days ago " + PrevDay , PrevDay.TakeValueColor());
AddLabel(1, "Current Price = " + Current_Price , Current_Price.TakeValueColor());
#END Price Comparison From Previous Day at the same bar")
It's almost what I'm looking for. I ended up being able to stack percentage changes of multiple securities from the market open. Unfortunately they bleed over into another. Don't know yet if that's a desired effect. Thx Ben.@btran1993 Did you try the built-in Comparison indicator in ThinkorSwim?
Hi - is there a way to plot this without having to plot the current days price action? It seems that the previous day's price action for a given time does not plot until the current bar is being formedi was pretty bored.. 2hrs later here you go what you requested:
Its Price Comparison From Previous Day at the same bar (or same time )and can be adjusted to compare XZY days ago by adjusting the "DaysAgo"
remember to hit the like button if you liked my post!

Code:#Price Comparison From Previous Day at the same bar input DaysAgo = 1; def c = close; def x = BarNumber(); def nan = double.nan; def RTHbar1 = if getday()<>getday()[Daysago] then x else RTHbar1[1]; def PrevRTHbar1 = if RTHbar1 != RTHbar1[1] then RTHbar1[1] else PrevRTHbar1[1]; def indexBar = RTHbar1 - PrevRTHbar1; plot PrevDay = if IsNaN(c) then nan else GetValue(c, indexBar); PrevDay.SetPaintingStrategy(PaintingStrategy.LINE); PrevDay.SetDefaultColor(CreateColor(0, 255, 255)); PrevDay.SetLineWeight(1); plot Current_Price = c; Current_Price.SetPaintingStrategy(PaintingStrategy.LINE); Current_Price.SetDefaultColor(CreateColor(0, 191, 0)); Current_Price.SetLineWeight(1); AddLabel(1, "Same Bar Comparison from " + DaysAgo + " Days ago " + PrevDay , PrevDay.TakeValueColor()); AddLabel(1, "Current Price = " + Current_Price , Current_Price.TakeValueColor()); #END Price Comparison From Previous Day at the same bar
Hi - I noticed it does not work for any previous day beyond 1 day ago - if i set 'days ago' to 2 or 3, the line is the same - can you look to fix?FIRST: You will have to set the aggregation period in the study to match your chart.
SECOND: use the DISPLACE feature in the study to shift it over (you pretty much count how many bars are in each day and set it at that number)
takes a little bit of work but it works. Not sure what its worth to you, but in about 5 mins you should be able to adjust to your liking.
Code:input aggregationPeriod = AggregationPeriod.DAY; input length = 1; input displace = -1; input showOnlyLastPeriod = no; plot PrevDayClose; if showOnlyLastPeriod and !IsNaN(close(period = aggregationPeriod)[-1]) { PrevDayClose = Double.NaN; } else { PrevDayClose = Highest(close(period = aggregationPeriod)[-displace], length); }
Here's an example of what I'm talking about..
Cyan = 1 day ago
White = 2 days ago
Green = 3 days ago
white and green overlap
thx..so as an example...how would i set this up on a 5 min chart?Hi - I noticed it does not work for any previous day beyond 1 day ago - if i set 'days ago' to 2 or 3, the line is the same - can you look to fix?
View attachment 24965
Here's an example of what I'm talking about..
Cyan = 1 day ago
White = 2 days ago
Green = 3 days ago
white and green overlap
Hi - I noticed it does not work for any previous day beyond 1 day ago - if i set 'days ago' to 2 or 3, the line is the same - can you look to fix?
Here's an example of what I'm talking about..
Cyan = 1 day ago
White = 2 days ago
Green = 3 days ago
white and green overlap
your picture is too small be describe what you want.
your words are confusing
why just white and green overlap?? cyan would overlap too.
all you had to say is,
go read data from x previous days, and display the data on current day
Hi - I noticed it does not work for any previous day beyond 1 day ago - if i set 'days ago' to 2 or 3, the line is the same - can you look to fix?
Here's an example of what I'm talking about..
Cyan = 1 day ago
White = 2 days ago
Green = 3 days ago
white and green overlap
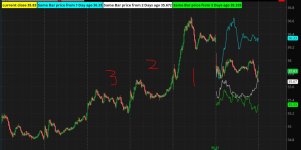
this shows close prices from 1 , 2, 3 days ago. and plots them on the current day
#prev_days_data_overlay_2

#https://usethinkscript.com/threads/overlay-previous-2-days-of-data.4825/
#Overlay previous 2 days of data
#lance  dateDec 14, 2020
#1
#Hello - is there someone who can create an indicator that overlays price action from yesterday's and 2 days ago?


#You can also build yourself a lower indicator for your markets open/closed using secondsTill() and secondsFrom() if you need.

#XeoNoX
#6
#i was pretty bored.. 2hrs later here you go what you requested:
#Its Price Comparison From Previous Day at the same bar (or same time )and can be adjusted to compare XZY days ago by adjusting the "DaysAgo"


def bn = BarNumber();
def na = double.nan;


#Price Comparison From Previous Day at the same bar

input Daysago = 1;
def cls = close;
def gd = getday();
def newday = gd <> gd[1];
def rthbar1 = if newday then bn else rthbar1[1];
def daycnt = if newday then daycnt[1] + 1 else daycnt[1];


def n = 800;
def day1off;
def day2off;
def day3off;
def day1bn;
def day2bn;
def day3bn;
if bn == 1 then {
 day1off = 0;
 day2off = 0;
 day3off = 0;
 day1bn = 0;
 day2bn = 0;
 day3bn = 0;

} else if newday and gd == getlastday() then {

 day1off = fold a = 0 to n
   with b
   while getvalue(rthbar1,a-0) == rthbar1
   do b+1;
 day1bn = getvalue(rthbar1,day1off);

 day2off = fold c = 0 to n
   with d = 0
   while getvalue(rthbar1,c-0) >= day1bn
   do d+1;
 day2bn = getvalue(rthbar1,day2off);
# day2bn = getvalue(bn,day2off);

 day3off = fold e = 0 to n
   with f = 0
   while getvalue(rthbar1,e-0) >= day2bn
   do f+1;
 day3bn = getvalue(rthbar1,day3off);
# day3bn = getvalue(bn,day3off);

} else {
 day1off = day1off[1];
 day2off = day2off[1];
 day3off = day3off[1];
 day1bn = day1bn[1];
 day2bn = day2bn[1];
 day3bn = day3bn[1];
}


addchartbubble(0, low*.99,
bn + "\n" +
rthbar1 + "\n\n" +
day1off + "\n" +
day1bn + "\n" +
day2off + "\n" +
day2bn + "\n" +
day3off + "\n" +
day3bn + "\n"
, color.yellow, no);


#def PrevRTHbar1 = if RTHbar1 != RTHbar1[1] then RTHbar1[1] else PrevRTHbar1[1];
#def indexBar = RTHbar1 - PrevRTHbar1;


def indexbar1;
def indexbar2;
def indexbar3;
if gd == getlastday() then {
 indexbar1 = rthbar1 - day1bn;
 indexbar2 = rthbar1 - day2bn;
 indexbar3 = rthbar1 - day3bn;
} else {
 indexbar1 = 0;
 indexbar2 = 0;
 indexbar3 = 0;
}


addchartbubble(0, low*.99,
bn + "\n" +
indexbar1 + "\n" +
indexbar2 + "\n" +
indexbar3 + "\n"
, color.yellow, no);


#Cyan = 1 day ago
#White = 2 days ago
#Green = 3 days ago

plot PrevDay1 = if gd == getlastday() then GetValue(cls, indexBar1) else na;
PrevDay1.SetDefaultColor(color.cyan);

plot PrevDay2 = if gd == getlastday() then GetValue(cls, indexBar2) else na;
PrevDay2.SetDefaultColor(color.white);

plot PrevDay3 = if gd == getlastday() then GetValue(cls, indexBar3) else na;
PrevDay3.SetDefaultColor(color.green);


AddLabel(1, "current close " + close , color.yellow);
AddLabel(1, "Same Bar price from 1 Day ago " + PrevDay1 , PrevDay1.TakeValueColor());
AddLabel(1, "Same Bar price from 2 Days ago " + PrevDay2 , PrevDay2.TakeValueColor());
AddLabel(1, "Same Bar price from 3 Days ago " + PrevDay3 , PrevDay3.TakeValueColor());
#
Attachments
this shows close prices from 1 , 2, 3 days ago. and plots them on the current day
Code:#prev_days_data_overlay_2 #https://usethinkscript.com/threads/overlay-previous-2-days-of-data.4825/ #Overlay previous 2 days of data #lance dateDec 14, 2020 #1 #Hello - is there someone who can create an indicator that overlays price action from yesterday's and 2 days ago? #You can also build yourself a lower indicator for your markets open/closed using secondsTill() and secondsFrom() if you need. #XeoNoX #6 #i was pretty bored.. 2hrs later here you go what you requested: #Its Price Comparison From Previous Day at the same bar (or same time )and can be adjusted to compare XZY days ago by adjusting the "DaysAgo" def bn = BarNumber(); def na = double.nan; #Price Comparison From Previous Day at the same bar input Daysago = 1; def cls = close; def gd = getday(); def newday = gd <> gd[1]; def rthbar1 = if newday then bn else rthbar1[1]; def daycnt = if newday then daycnt[1] + 1 else daycnt[1]; def n = 800; def day1off; def day2off; def day3off; def day1bn; def day2bn; def day3bn; if bn == 1 then { day1off = 0; day2off = 0; day3off = 0; day1bn = 0; day2bn = 0; day3bn = 0; } else if newday and gd == getlastday() then { day1off = fold a = 0 to n with b while getvalue(rthbar1,a-0) == rthbar1 do b+1; day1bn = getvalue(rthbar1,day1off); day2off = fold c = 0 to n with d = 0 while getvalue(rthbar1,c-0) >= day1bn do d+1; day2bn = getvalue(rthbar1,day2off); # day2bn = getvalue(bn,day2off); day3off = fold e = 0 to n with f = 0 while getvalue(rthbar1,e-0) >= day2bn do f+1; day3bn = getvalue(rthbar1,day3off); # day3bn = getvalue(bn,day3off); } else { day1off = day1off[1]; day2off = day2off[1]; day3off = day3off[1]; day1bn = day1bn[1]; day2bn = day2bn[1]; day3bn = day3bn[1]; } addchartbubble(0, low*.99, bn + "\n" + rthbar1 + "\n\n" + day1off + "\n" + day1bn + "\n" + day2off + "\n" + day2bn + "\n" + day3off + "\n" + day3bn + "\n" , color.yellow, no); #def PrevRTHbar1 = if RTHbar1 != RTHbar1[1] then RTHbar1[1] else PrevRTHbar1[1]; #def indexBar = RTHbar1 - PrevRTHbar1; def indexbar1; def indexbar2; def indexbar3; if gd == getlastday() then { indexbar1 = rthbar1 - day1bn; indexbar2 = rthbar1 - day2bn; indexbar3 = rthbar1 - day3bn; } else { indexbar1 = 0; indexbar2 = 0; indexbar3 = 0; } addchartbubble(0, low*.99, bn + "\n" + indexbar1 + "\n" + indexbar2 + "\n" + indexbar3 + "\n" , color.yellow, no); #Cyan = 1 day ago #White = 2 days ago #Green = 3 days ago plot PrevDay1 = if gd == getlastday() then GetValue(cls, indexBar1) else na; PrevDay1.SetDefaultColor(color.cyan); plot PrevDay2 = if gd == getlastday() then GetValue(cls, indexBar2) else na; PrevDay2.SetDefaultColor(color.white); plot PrevDay3 = if gd == getlastday() then GetValue(cls, indexBar3) else na; PrevDay3.SetDefaultColor(color.green); AddLabel(1, "current close " + close , color.yellow); AddLabel(1, "Same Bar price from 1 Day ago " + PrevDay1 , PrevDay1.TakeValueColor()); AddLabel(1, "Same Bar price from 2 Days ago " + PrevDay2 , PrevDay2.TakeValueColor()); AddLabel(1, "Same Bar price from 3 Days ago " + PrevDay3 , PrevDay3.TakeValueColor()); #
Thanks - this is better but it is not plotting for previous days - is there a way to show the lines from the beginning of the chart? (Screenshot i provided is just for 2 lines since that's all i need)
| Thread starter | Similar threads | Forum | Replies | Date |
|---|---|---|---|---|
| B | Dynamically display underlying equity as an overlay on any option chart | Questions | 6 | |
| J | How to overlay a line chart onto my candle chart... | Questions | 10 | |
| E | Heiken Ashi Overlay Displaced | Questions | 2 | |
| T | Heikin Ashi overlay | Questions | 1 | |
| R | MACD + TTM SQUEEZE OVERLAY | Questions | 11 |
Similar threads
-
Dynamically display underlying equity as an overlay on any option chart
- Started by bcaka
- Replies: 6
-
-
-
T
-
Not the exact question you're looking for?
Start a new thread and receive assistance from our community.
Similar threads
-
Dynamically display underlying equity as an overlay on any option chart
- Started by bcaka
- Replies: 6
-
-
-
T
-
Similar threads
-
Dynamically display underlying equity as an overlay on any option chart
- Started by bcaka
- Replies: 6
-
-
-
T
-
The Market Trading Game Changer
- Exclusive indicators
- Proven strategies & setups
- Private Discord community
- ‘Buy The Dip’ signal alerts
- Exclusive members-only content
- Add-ons and resources
- 1 full year of unlimited support
Frequently Asked Questions
useThinkScript is the #1 community of stock market investors using indicators and other tools to power their trading strategies. Traders of all skill levels use our forums to learn about scripting and indicators, help each other, and discover new ways to gain an edge in the markets.
We get it. Our forum can be intimidating, if not overwhelming. With thousands of topics, tens of thousands of posts, our community has created an incredibly deep knowledge base for stock traders. No one can ever exhaust every resource provided on our site.
If you are new, or just looking for guidance, here are some helpful links to get you started.
- The most viewed thread:
https://usethinkscript.com/threads/repainting-trend-reversal-for-thinkorswim.183/ - Our most popular indicator:
https://usethinkscript.com/threads/buy-the-dip-indicator-for-thinkorswim.3553/ - Answers to frequently asked questions:
https://usethinkscript.com/threads/answers-to-commonly-asked-questions.6006/