Hi All,
There is a filter on Fidelity's Active Trader Pro called "Bullish Morning Momentum" which:
It can often find stocks that have a nice upwardly sloping price line for the morning hours.
Would anyone know how to write the TOS script to create that indicator?
Thanks Much!
Scott
There is a filter on Fidelity's Active Trader Pro called "Bullish Morning Momentum" which:
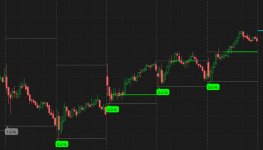
[B]Finds stocks that opened today within 1% of today's low and current price is higher than the previous trading session's high.[/B]It can often find stocks that have a nice upwardly sloping price line for the morning hours.
Would anyone know how to write the TOS script to create that indicator?
Thanks Much!
Scott