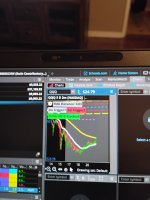
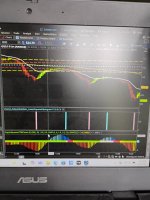
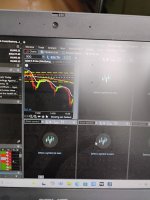
Can anyone give me some guidance? I have a chart that I like to use with a few lower studies like TTM Squeeze etc. I want to make this chart into a grid with several tickers that I can review at the same time before choosing one to trade. But when I try to convert that one chart into a grid with a several grid boxes all the lower indicators are cut off and I get this "i" symbol in the upper left of each box saying that that the lower studies can't fit. I know it can be done because I have seen several images of grids with multiple tickers on this forum and YouTube where the lower indicators are clearly visible. So the issue seems to be that I am not doing it correctly. Any step by step assistance from the forum members would be greatly appreciated.
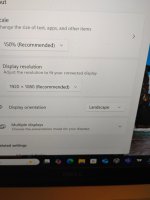
Pics are attached. The screen resolution is 1366x768, which is setting recommended by the ASUS Laptop I am using.
Pics are attached. The screen resolution is 1366x768, which is setting recommended by the ASUS Laptop I am using.
Attachments

Last edited by a moderator: