
Hi Traders!
We live in a really exciting time of AI, and honestly, I am looking forward to seeing how AI can make us better traders. Personally, I love chatGPT and have paired my market curiosity with its ability to reason to hopefully bring some novel indicators for you guys. However, in my attempts to be novel, I might make something a) Completely useless and b) inadvertently copy someone else's stuff. I always use my own indicators, sometimes not until after I share them, though. I hope you enjoy
What is it?
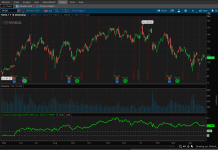
This indicator tracks a stock’s cumulative relative strength compared to a selected market or sector ETF. It helps identify whether the stock is consistently outperforming or underperforming its benchmark over time by plotting the daily change in their price ratio.
How to use it?
To use it, add the script to your chart and select the benchmark ETF (like SPY, QQQ, or SOXX) from the dropdown to compare your stock’s performance. A rising line indicates consistent outperformance, while a falling line shows underperformance.
To add more benchmarks, simply extend the dropdown list and etfClose logic with new symbols (e.g., add else if marketETF == marketETF."SOXX" then close("SOXX")).
What makes this a different perspective?
What makes this indicator unique is that it accumulates the daily relative performance, showing not just momentary strength but the long-term trend of outperformance or underperformance. Unlike traditional relative strength indicators, this version offers a smoother, more intuitive view of how a stock stacks up against a chosen benchmark over time.

We live in a really exciting time of AI, and honestly, I am looking forward to seeing how AI can make us better traders. Personally, I love chatGPT and have paired my market curiosity with its ability to reason to hopefully bring some novel indicators for you guys. However, in my attempts to be novel, I might make something a) Completely useless and b) inadvertently copy someone else's stuff. I always use my own indicators, sometimes not until after I share them, though. I hope you enjoy
What is it?
This indicator tracks a stock’s cumulative relative strength compared to a selected market or sector ETF. It helps identify whether the stock is consistently outperforming or underperforming its benchmark over time by plotting the daily change in their price ratio.
How to use it?
To use it, add the script to your chart and select the benchmark ETF (like SPY, QQQ, or SOXX) from the dropdown to compare your stock’s performance. A rising line indicates consistent outperformance, while a falling line shows underperformance.
To add more benchmarks, simply extend the dropdown list and etfClose logic with new symbols (e.g., add else if marketETF == marketETF."SOXX" then close("SOXX")).
What makes this a different perspective?
What makes this indicator unique is that it accumulates the daily relative performance, showing not just momentary strength but the long-term trend of outperformance or underperformance. Unlike traditional relative strength indicators, this version offers a smoother, more intuitive view of how a stock stacks up against a chosen benchmark over time.
Code:
declare lower;

input marketETF = {default "SPY", "QQQ", "DIA", "IWM", "TAN", "XLK", "XLF", "SMH"};
input showThresholds = yes;
input thresholdLevel = 0.05;


# Correct ETF close price
def etfClose =
       if marketETF == marketETF."SPY" then close("SPY")
    else if marketETF == marketETF."QQQ" then close("QQQ")
    else if marketETF == marketETF."DIA" then close("DIA")
    else if marketETF == marketETF."IWM" then close("IWM")
    else if marketETF == marketETF."TAN" then close("TAN")
    else if marketETF == marketETF."XLK" then close("XLK")
    else if marketETF == marketETF."XLF" then close("XLF")
    else if marketETF == marketETF."SMH" then close("SMH")
    else close;


# Relative performance ratio
def ratio = close / etfClose;

# ✅ Correct delta = change in ratio, not offset from 1.0
def delta = ratio - ratio[1];
def cumDelta = if IsNaN(cumDelta[1]) then 0 else cumDelta[1] + delta;

# Plot cumulative relative strength
plot CumRelativeStrength = cumDelta;
CumRelativeStrength.SetLineWeight(2);
CumRelativeStrength.AssignValueColor(if cumDelta > 0 then Color.GREEN else if cumDelta < 0 then Color.RED else Color.GRAY);

# Optional reference lines
plot ZeroLine = 0;
ZeroLine.SetDefaultColor(Color.LIGHT_GRAY);
ZeroLine.SetStyle(Curve.SHORT_DASH);

plot UpperThresh = if showThresholds then thresholdLevel else Double.NaN;
plot LowerThresh = if showThresholds then -thresholdLevel else Double.NaN;
UpperThresh.SetDefaultColor(Color.LIGHT_GREEN);
UpperThresh.SetStyle(Curve.SHORT_DASH);
LowerThresh.SetDefaultColor(Color.PINK);
LowerThresh.SetStyle(Curve.SHORT_DASH);
Attachments
Last edited by a moderator:
