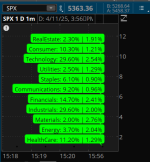
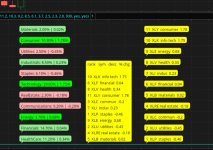
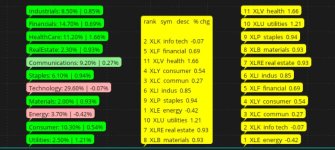
I have taken sections of code discussed in this thread
https://usethinkscript.com/threads/sector-rotation-indicator-for-thinkorswim.845/
and modified it in an attempt to rank and sort the percentage change of each sector since the open of the trading day.
But the ranking is not working in the way I had intended. I'd like it to be sorted from highest change to lowest. I would appreciate any feedback that might help me fix this. Thanx!
Code:
# Displays sector weightings and percentage change from the beginning
# of the trading day.

# SECTOR WEIGHTINGS SHOULD BE UPDATED EVERY FIRST DAY OF THE MONTH
# BEST SOURCE https://www.spglobal.com/spdji/en/indices/equity/sp-500/#data
# Use Sector Breakdown section towards the bottom of page.

# OTHER SOURCES
# https://eresearch.fidelity.com/eresearch/markets_sectors/sectors/si_weighting_recommendations.jhtml?tab=sirecommendations
# https://www.sectorspdr.com/sectorspdr/sector/xli
# https://siblisresearch.com/data/us-sector-weightings/
# https://seekingalpha.com/etfs-and-funds/etf-tables/sectors
# https://www.spglobal.com/spdji/en/indices/equity/sp-500/#data
# https://www.sectorspdr.com/sectorspdr/sectors

declare lower;

input XLK = 29.6 ; #info tech XLK
input XLF = 14.7 ; #financial XLF
input XLV = 11.2 ;  #healthcare XLV
input XLY = 10.3 ;  #cons.discetion XLY
input XLC = 9.2 ;   #communications XLC
input XLI = 8.5 ;   #industrials XLI
input XLP = 6.1 ;   #staples XLP
input XLE = 3.7;   #energy  XLE
input XLU = 2.5;   #utilities XLU
input XLRE = 2.3 ;  #real estate XLRE
input XLB = 2.0;   #materials XLB


script na {
    plot na = Double.NaN;
}
script date {
    plot date = GetYYYYMMDD();
}
script rthStart {
    plot rthStart = RegularTradingStart(date()) / AggregationPeriod.MIN;
}
script rthEnd {
    plot rthEnd = RegularTradingEnd(date())  / AggregationPeriod.MIN;
}
script firstBar {
    plot firstBar = BarNumber() == 1;
}
script rth {
    plot rth;
    plot tod = (GetTime() / AggregationPeriod.MIN);
    rth = tod between rthStart() and rthEnd();
}
script globex {
    plot globex = !rth();
}
script intraDay {
    plot intraDay = GetAggregationPeriod() < AggregationPeriod.DAY;
}
script datechanged {
    plot datechanged = date() != date()[1];
}
script rthchanged {
    plot rthchanged = rth() != rth()[1];
}
script rthstarted {
    plot rthstarted;
    rthstarted = rth() and (rthchanged() or datechanged());
}
script rthended {
    plot rthended;
    plot rth = rth();
    rthended = rthStarted() or (!rth() and rthchanged());
}

# End KW_RTH

AddLabel(!intraDay(), "Not available on this time frame", Color.GRAY);
def show = IntraDay();

DefineGlobalColor("2", Color.Pink);
DefineGlobalColor("1",  Color.RED);
DefineGlobalColor("3", Color.LIGHT_GREEN);
DefineGlobalColor("4", Color.GREEN);

script opn {
    plot r;
    input cur = 0;
    input prev = 0;
    r = If(
    !intraDay(), Double.NaN,
    If(
      firstBar(),
      If(rth(), cur, Double.NaN),
      If(rthStarted() and !IsNaN(cur), cur, prev)
    )
);
}

script cls {
    input cur = 0;
    input prev = 0;

    plot cls;
    plot rth = rth();

    cls = If(
    !intraDay(), Double.NaN,
    If(
      firstBar(),
      If(rth, cur, Double.NaN),
      If(rth and !IsNaN(cur), cur, prev)
    )
  );
}

script pct {
    plot r;
    input op = 0;
    input cl = 0;

    plot diff = cl - op;
    r = If(IsNaN(op) or IsNaN(cl), 0, Round((diff / op) * 100, 2));
}

input Open_Time = 930;

def ko;
ko = opn(open("XLK"), ko[1]);
def kc;
kc = cls(close("XLK"), kc[1]);
def kp = pct(ko, kc);

def fo;
fo = opn(open("XLF"), fo[1]);
def fc;
fc = cls(close("XLF"), fc[1]);
def fp = pct(fo, fc);

def vo;
vo = opn(open("XLV"), vo[1]);
def vc;
vc = cls(close("XLV"), vc[1]);
def vp = pct(vo, vc);

def yo;
yo = opn(open("XLY"), yo[1]);
def yc;
yc = cls(close("XLY"), yc[1]);
def yp = pct(yo, yc);

def co;
co = opn(open("XLC"), co[1]);
def cc;
cc = cls(close("XLC"), cc[1]);
def cp = pct(co, cc);

def io;
io = opn(open("XLI"), io[1]);
def ic;
ic = cls(close("XLI"), ic[1]);
def ip = pct(io, ic);

def po;
po = opn(open("XLP"), po[1]);
def pc;
pc = cls(close("XLP"), pc[1]);
def pp = pct(po, pc);

def eo;
eo = opn(open("XLE"), eo[1]);
def ec;
ec = cls(close("XLE"), ec[1]);
def ep = pct(eo, ec);

def uo;
uo = opn(open("XLU"), uo[1]);
def uc;
uc = cls(close("XLU"), uc[1]);
def up = pct(uo, uc);

def reo;
reo = opn(open("XLRE"), reo[1]);
def recl;
recl = cls(close("XLRE"), recl[1]);
def rep = pct(reo, recl);

def bo;
bo = opn(open("XLB"), bo[1]);
def bc;
bc = cls(close("XLB"), bc[1]);
def bp = pct(bo, bc);


def st1 = kp;
def st2 = fp;
def st3 = vp;
def st4 = yp;
def st5 = cp;
def st6 = ip;
def st7 = pp;
def st8 = ep;
def st9 = up;
def st10 = rep;
def st11 = bp;


# determine interger sequence (ranking)
def c1 = (st1>st2)+(st1>st3)+(st1>st4)+(st1>st5)+(st1>st6)+(st1>st7)+(st1>st8)+(st1>st9)+(st1>st10)+(st1>st11)+1;
def c2 = (st2>st1)+(st2>st3)+(st2>st4)+(st2>st5)+(st2>st6)+(st2>st7)+(st2>st8)+(st2>st9)+(st2>st10)+(st2>st11)+1;
def c3 = (st3>st1)+(st3>st2)+(st3>st4)+(st3>st5)+(st3>st6)+(st3>st7)+(st3>st8)+(st3>st9)+(st3>st10)+(st3>st11)+1;
def c4 = (st4>st1)+(st4>st2)+(st4>st3)+(st4>st5)+(st4>st6)+(st4>st7)+(st4>st8)+(st4>st9)+(st4>st10)+(st4>st11)+1;
def c5 = (st5>st1)+(st5>st2)+(st5>st3)+(st5>st4)+(st5>st6)+(st5>st7)+(st5>st8)+(st5>st9)+(st5>st10)+(st5>st11)+1;
def c6 = (st6>st1)+(st6>st2)+(st6>st3)+(st6>st4)+(st6>st5)+(st6>st7)+(st6>st8)+(st6>st9)+(st6>st10)+(st6>st11)+1;
def c7 = (st7>st1)+(st7>st2)+(st7>st3)+(st7>st4)+(st7>st5)+(st7>st6)+(st7>st8)+(st7>st9)+(st7>st10)+(st7>st11)+1;
def c8 = (st8>st1)+(st8>st2)+(st8>st3)+(st8>st4)+(st8>st5)+(st8>st6)+(st8>st7)+(st8>st9)+(st8>st10)+(st8>st11)+1;
def c9 = (st9>st1)+(st9>st2)+(st9>st3)+(st9>st4)+(st9>st5)+(st9>st6)+(st9>st7)+(st9>st8)+(st9>st10)+(st9>st11)+1;
def c10 = (st10>st1)+(st10>st2)+(st10>st3)+(st10>st4)+(st10>st5)+(st10>st6)+(st10>st7)+(st10>st8)+(st10>st9)+(st10>st11)+1;
def c11 = (st11>st1)+(st11>st2)+(st11>st3)+(st11>st4)+(st11>st5)+(st11>st6)+(st11>st7)+(st11>st8)+(st11>st9)+(st11>st10)+1;


# remove duplicate sequence numbers
def d1 = c1;
def d2 = c2+(c2==c1);
def d3 = c3+(c3==c1)+(c3==c2);
def d4 = c4+(c4==c1)+(c4==c2)+(c4==c3);
def d5 = c5+(c5==c1)+(c5==c2)+(c5==c3)+(c5==c4);
def d6 = c6+(c6==c1)+(c6==c2)+(c6==c3)+(c6==c4)+(c6==c5);
def d7 = c7+(c7==c1)+(c7==c2)+(c7==c3)+(c7==c4)+(c7==c5)+(c7==c6);
def d8 = c8+(c8==c1)+(c8==c2)+(c8==c3)+(c8==c4)+(c8==c5)+(c8==c6)+(c8==c7);
def d9 = c9+(c9==c1)+(c9==c2)+(c9==c3)+(c9==c4)+(c9==c5)+(c9==c6)+(c9==c7)+(c9==c8);
def d10 = c10+(c10==c1)+(c10==c2)+(c10==c3)+(c10==c4)+(c10==c5)+(c10==c6)+(c10==c7)+(c10==c8)+(c10==c9);
def d11 = c11+(c11==c1)+(c11==c2)+(c11==c3)+(c11==c4)+(c11==c5)+(c11==c6)+(c11==c7)+(c11==c8)+(c11==c9)+(c11==c10);


def rank1 = d1;
def rank2 = d2;
def rank3 = d3;
def rank4 = d4;
def rank5 = d5;
def rank6 = d6;
def rank7 = d7;
def rank8 = d8;
def rank9 = d9;
def rank10 = d10;
def rank11 = d11;

plot one = 1;

AddChartBubble(IsNaN(close[-1]) and !IsNaN(close), rank1, "Consumer: " + AsText(XLY) + "% | " + AsText(yp) + "%", if (yp < -.5) then GlobalColor("1")
    else if yp < 0 then GlobalColor("2")
    else if yp > .5 then GlobalColor("4")
    else GlobalColor("3"));

AddChartBubble(IsNaN(close[-1]) and !IsNaN(close), rank2, "Technology: " + AsText(XLK) + "% | " + AsText(kp) + "%", if (kp < -.5) then GlobalColor("1")
    else if kp < 0 then GlobalColor("2")
    else if kp > .5 then GlobalColor("4")
    else GlobalColor("3"));

AddChartBubble(IsNaN(close[-1]) and !IsNaN(close), rank3, "Industrials: " + AsText(XLK) + "% | " + AsText(ip) + "%", if (ip < -.5) then GlobalColor("1")
    else if ip < 0 then GlobalColor("2")
    else if ip > .5 then GlobalColor("4")
    else GlobalColor("3"));

AddChartBubble(IsNaN(close[-1]) and !IsNaN(close), rank4, "Materials: " + AsText(XLB) + "% | " + AsText(bp) + "%", if (bp < -.5) then GlobalColor("1")
    else if bp < 0 then GlobalColor("2")
    else if bp > .5 then GlobalColor("4")
    else GlobalColor("3"));

AddChartBubble(IsNaN(close[-1]) and !IsNaN(close), rank5, "Energy: " + AsText(XLE) + "% | " + AsText(ep) + "%", if (ep < -.5) then GlobalColor("1")
    else if ep < 0 then GlobalColor("2")
    else if ep > .5 then GlobalColor("4")
    else GlobalColor("3"));

AddChartBubble(IsNaN(close[-1]) and !IsNaN(close), rank6, "Staples: " + AsText(XLP) + "% | " + AsText(pp) + "%", if (pp < -.5) then GlobalColor("1")
    else if pp < 0 then GlobalColor("2")
    else if pp > .5 then GlobalColor("4")
    else GlobalColor("3"));


AddChartBubble(IsNaN(close[-1]) and !IsNaN(close), rank7, "HealthCare: " + AsText(XLV) + "% | " + AsText(vp) + "%", if (vp < -.5) then GlobalColor("1")
    else if vp < 0 then GlobalColor("2")
    else if vp > .5 then GlobalColor("4")
    else GlobalColor("3"));

# rank8.SetDefaultColor(Color.VIOLET);

AddChartBubble(IsNaN(close[-1]) and !IsNaN(close), rank8, "Utilities: " + AsText(XLU) + "% | " + AsText(up) + "%", if (up < -.5) then GlobalColor("1")
    else if up < 0 then GlobalColor("2")
    else if up > .5 then GlobalColor("4")
    else GlobalColor("3"));

AddChartBubble(IsNaN(close[-1]) and !IsNaN(close), rank9, "Financials: " + AsText(XLF) + "% | " + AsText(fp) + "%", if (fp < -.5) then GlobalColor("1")
    else if fp < 0 then GlobalColor("2")
    else if fp > .5 then GlobalColor("4")
    else GlobalColor("3"));

AddChartBubble(IsNaN(close[-1]) and !IsNaN(close), rank10, "Communications: " + AsText(XLC) + "% | " + AsText(cp) + "%", if (cp < -.5) then GlobalColor("1")
    else if cp < 0 then GlobalColor("2")
    else if cp > .5 then GlobalColor("4")
    else GlobalColor("3"));

AddChartBubble(IsNaN(close[-1]) and !IsNaN(close), rank11, "RealEstate: " + AsText(XLRE) + "% | " + AsText(rep) + "%", if (rep < -.5) then GlobalColor("1")
    else if rep < 0 then GlobalColor("2")
    else if rep > .5 then GlobalColor("4")
    else GlobalColor("3"));

#EOC
Attachments
Last edited by a moderator:


