As Good As It Gets Visual Options Trading Chart
My goal is to develop charts that are easy to trade and visually appealing to the eye
(each person visualizes differently).
When learning to trade options right
Pick a chart that’s good by sight
As with good indicators they are made
So, if you want to elevate your wins
You should take my charts for a few good spins!
-csr
This is the link for this new dual chart:
http://tos.mx/!Kj9bc5iQ
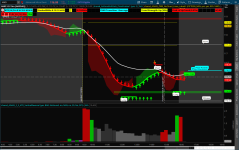
This is what it looks like:
I find this an easy chart to trade.
My Put trades are placed when I get a lower Red Bar, a Red Traffic Light and MTF shows longer time frames Red as well.
I also view my chart arrows for direction. A Call would just be the opposite (Green Bar, Green Traffic Light, Green MTFs and Green Arrows on Chart).
I find
my best two trades of the day are usually between 10:00 - Noon when two or more indicators align. Also note if trading is above/below VWAP and/or 20 EMA White Line.
Watch for crossovers of the 20 EMA.