You should upgrade or use an alternative browser.
Vanna Thinkscript
- Thread starter Carlosack
- Start date
Attachments
Join useThinkScript to post your question to a community of 21,000+ developers and traders.
spartan.ts
Member
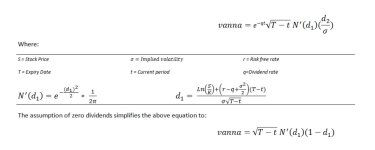
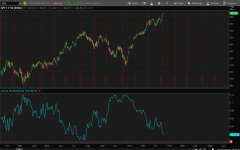
can find it with searchCould someone help me code a thinkscript for Vanna? I know it can be done because I've seen it (pictures below) but when trying to use chatgpt to help me, it has gotten me nowhere. The thinkscript was coded from the formula in the pictures.
def Under =
    Close(GetunderlyingSymbol());
def Strike =
    GetStrike();
def DTE =
    GetDaysToExpiration() / 365;
def Rate =
    GetInterestRate() * 0.01;
def Div =
    if !isNaN(GetDividend()) then GetDividend()
    else Div[1];
def Yield =
    if Div then Div / Under
    else 0;
def IV =
    Imp_Volatility(GetUnderlyingSymbol());
def Pi =
    Double.Pi; #3.14
def e =
    2.718281828; #Euler's number (sort of like Pi)
def D1 =
    (Log(Under/Strike) + (rate - yield + (Power(IV,2) / 2)) * DTE) / (IV * Sqrt(DTE));
def N1D1 =
    power(e,-(power(D1,2)/2)) * (1 / (2 * Pi));
def Van =
    SqRt(DTE) * N1D1 * (1 - D1); #assumes 0 dividend

plot Vanna = Van * -1;Could someone help me code a thinkscript for Vanna? I know it can be done because I've seen it (pictures below) but when trying to use chatgpt to help me, it has gotten me nowhere. The thinkscript was coded from the formula in the pictures.
EDIT -----------
i think this is the right formulas.
i looked at that ref web page below, and changed my study. now it plots something.
i see spartan.ts posted a study, so maybe go with that...
-----------------------------------
k isn't defined in formula image. i think it is strike
#vanna_00

#https://usethinkscript.com/threads/vanna-thinkscript.17654/
#Vanna Thinkscript
#aeb  Jan 8, 2024  #2
# a thinkscript for Vanna?

# look at formulas on this page to figure out code
#https://financetrainingcourse.com/education/2014/06/vega-volga-and-vanna-the-volatility-greeks/


declare lower;

def na = double.nan;
def bn = barnumber();

# ref sym  .SPY240216C484

# dates
# expiry date    YYYYMMDD
input expire_date = 20240216;

# current date
#  if tb > expire date , in  CountTradingDays()  then error.  add if then to fix value of t
def tb = GetYYYYMMDD();
def t = if isnan(close) then t[1] else tb;

# experiment with 2 ways to count days.   use diff2
#   T-t  , days till expire
def diff1b = DaysTillDate(expire_date);
def diff2b = CountTradingDays(t, expire_date);

# fraction of year , /365  or  /252
def diff1 = diff1b/365;
def diff2 = diff2b/252;


def iv = imp_volatility();

#  k  - strike
def k = 486;

# dividend rate ,  0
def q = 0;

# risk free rate ??
def r = .27;

def s = close;


#  based on ref web page,  (t_exp - t)   should be  (t_exp - t)/365 , a fraction of a year
#def d1 = (log(s/k) + (r - q + (power(iv,2)/2)) * (t_exp - t)) / (iv * sqrt(t_exp - t));
def d1 = (log(s/k) + (r - q + (power(iv,2)/2)) * (diff2)) / (iv * sqrt(diff2));

def n1 = exp(-(power(d1,2))/2) / (2 * double.pi);

#def vanna = Sqrt(t_exp - t) * n1 * (1-d1);
def vanna = Sqrt(diff2) * n1 * (1-d1);

plot z = vanna;

plot z0 = 0;

#------------------------------

addchartbubble(0,0,
d1 + "\n" +
n1 + "\n" +
vanna + "\n" +
 diff1b + "\n" +
 diff2b + "\n" +
 diff1 + "\n" +
 diff2
, color.yellow, yes);

#
this page seems to list the same formula image and might explain the numbers.
https://financetrainingcourse.com/education/2014/06/vega-volga-and-vanna-the-volatility-greeks/
Attachments
This would be much more useful as a per strike bar chart... like the Gamma Exposure chart on
can find it with search
Code:def Under = Close(GetunderlyingSymbol()); def Strike = GetStrike(); def DTE = GetDaysToExpiration() / 365; def Rate = GetInterestRate() * 0.01; def Div = if !isNaN(GetDividend()) then GetDividend() else Div[1]; def Yield = if Div then Div / Under else 0; def IV = Imp_Volatility(GetUnderlyingSymbol()); def Pi = Double.Pi; #3.14 def e = 2.718281828; #Euler's number (sort of like Pi) def D1 = (Log(Under/Strike) + (rate - yield + (Power(IV,2) / 2)) * DTE) / (IV * Sqrt(DTE)); def N1D1 = power(e,-(power(D1,2)/2)) * (1 / (2 * Pi)); def Van = SqRt(DTE) * N1D1 * (1 - D1); #assumes 0 dividend plot Vanna = Van * -1;
The problem with this formula is it doesn't scale correctly when paired with gamma (like in my original post). I'm sure it is just a matter of tweaking one or two things but can't figure it out.
quantumomegallc
Member
Either left axis one of them, or real_size, or use a normalized scale.The problem with this formula is it doesn't scale correctly when paired with gamma (like in my original post). I'm sure it is just a matter of tweaking one or two things but can't figure it out.
View attachment 21118
quantumomegallc
Member
I've changed my mind on this. I use it on Option Chains as values, and on the price chart as HighestAll LowestAll for a daily chart, plot lines across the area. I do this for Vanna, Gamma, Charm,Vega. It's very telling.View attachment 21107
This would be much more useful as a per strike bar chart... like the Gamma Exposure chart on
I use a script that has charm and speed on the same study, and Vanna and IV on another... I can't share the script, but if you could do that, that would be incredible... when Vanna crosses over IV, there are huge moves. also when charm crosses over speed.I've changed my mind on this. I use it on Option Chains as values, and on the price chart as HighestAll LowestAll for a daily chart, plot lines across the area. I do this for Vanna, Gamma, Charm,Vega. It's very telling.
Do you mind sharing?I use a script that has charm and speed on the same study, and Vanna and IV on another... I can't share the script, but if you could do that, that would be incredible... when Vanna crosses over IV, there are huge moves. also when charm crosses over speed.
Do you mind sharing?
He stated that it cannot be shared
I can't share the script
germanburrito
Active member
declare lower;

# Inputs
input price = close;
input strikePrice = 100; # Adjust to reflect your strike price
input riskFreeRate = 0.01; # Risk-free rate as a decimal
input timeToExpiryDays = 30; # Days to expiration
input smoothingFactor = 0.39894228; # 1/sqrt(2 * pi)

# Calculate Time to Expiration in Years
def timeToExpiry = timeToExpiryDays / 365;

# Pull the Implied Volatility from the Chart's Underlying Asset
def impliedVolatility = imp_volatility();

# Black-Scholes d1 Approximation
def d1 = (Log(price / strikePrice) + (riskFreeRate + Sqr(impliedVolatility) / 2) * timeToExpiry) / (impliedVolatility * Sqrt(timeToExpiry));

# Approximate N'(d1) ~ Gaussian PDF
def N_prime_d1 = Exp(-Sqr(d1) / 2) * smoothingFactor;

# Vanna Approximation
plot vanna = Sqrt(timeToExpiry) * N_prime_d1 * (1 - d1);

# Plot Vanna

Vanna.SetDefaultColor(Color.CYAN);
Vanna.SetLineWeight(2);

# Plot Implied Volatility (Scaled for Better Comparison)
plot ImpliedVolatilityLine = impliedVolatility;
ImpliedVolatilityLine.SetDefaultColor(Color.YELLOW);
ImpliedVolatilityLine.SetStyle(Curve.SHORT_DASH);
ImpliedVolatilityLine.SetLineWeight(2);

# Add Labels for Dynamic Volatility and Vanna
AddLabel(yes, "Vanna Approx: " + AsText(vanna), Color.CYAN);
AddLabel(yes, "Implied Volatility: " + AsPercent(impliedVolatility), Color.YELLOW);
AddLabel(yes, "d1: " + AsText(d1), Color.WHITE);

# Zero Line for Reference
plot ZeroLine = 0;
ZeroLine.SetDefaultColor(Color.GRAY);
ZeroLine.SetLineWeight(1);eigenvektor
New member
Hello, what do you exactly mean by that (I use it on Option Chains as values, and on the price chart as HighestAll LowestAll for a daily chart, plot lines across the area) thank youI've changed my mind on this. I use it on Option Chains as values, and on the price chart as HighestAll LowestAll for a daily chart, plot lines across the area. I do this for Vanna, Gamma, Charm,Vega. It's very telling.
Either left axis one of them, or real_size, or use a normalized scale.
Are you able to elaborate on any of these with a practical example?
quantumomegallc
Member
Do you want a picture as an exmample or a code sample?Are you able to elaborate on any of these with a practical example?
| Thread starter | Similar threads | Forum | Replies | Date |
|---|---|---|---|---|
| T | ThinkScript ---> Excel Question | Questions | 5 | |
| T | Updating watchlist in thinkscript | Questions | 1 | |
| K | Thinkscript close is 4:15 EST close I would like 4:00 EST | Questions | 1 | |
| T | Can Thinkscript track the mark price of an option? | Questions | 1 | |
| T | How to write over a thinkscript variable? | Questions | 6 |
Similar threads
-
-
-
Thinkscript close is 4:15 EST close I would like 4:00 EST
- Started by kblaine123
- Replies: 1
-
-
Not the exact question you're looking for?
Start a new thread and receive assistance from our community.
Similar threads
-
-
-
Thinkscript close is 4:15 EST close I would like 4:00 EST
- Started by kblaine123
- Replies: 1
-
-
Similar threads
-
-
-
Thinkscript close is 4:15 EST close I would like 4:00 EST
- Started by kblaine123
- Replies: 1
-
-
The Market Trading Game Changer
- Exclusive indicators
- Proven strategies & setups
- Private Discord community
- ‘Buy The Dip’ signal alerts
- Exclusive members-only content
- Add-ons and resources
- 1 full year of unlimited support
Frequently Asked Questions
useThinkScript is the #1 community of stock market investors using indicators and other tools to power their trading strategies. Traders of all skill levels use our forums to learn about scripting and indicators, help each other, and discover new ways to gain an edge in the markets.
We get it. Our forum can be intimidating, if not overwhelming. With thousands of topics, tens of thousands of posts, our community has created an incredibly deep knowledge base for stock traders. No one can ever exhaust every resource provided on our site.
If you are new, or just looking for guidance, here are some helpful links to get you started.
- The most viewed thread:
https://usethinkscript.com/threads/repainting-trend-reversal-for-thinkorswim.183/ - Our most popular indicator:
https://usethinkscript.com/threads/buy-the-dip-indicator-for-thinkorswim.3553/ - Answers to frequently asked questions:
https://usethinkscript.com/threads/answers-to-commonly-asked-questions.6006/


