I've seen other posts talking about angle calculation, but for some reason I can make it work.
I've used the code in the thinkOrSwim reference page for ATan to calculate an angle:
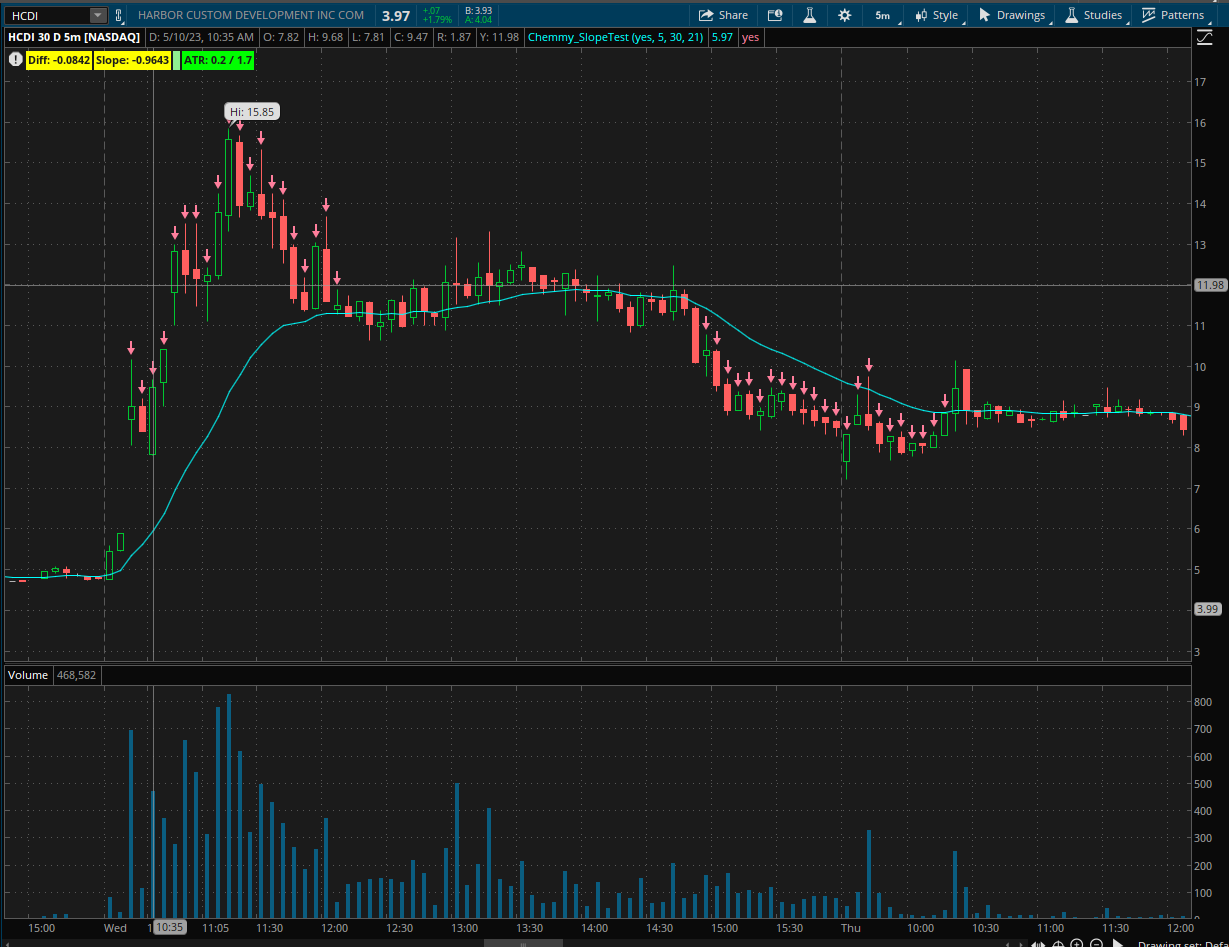
I created an indicator "slope" at the bottom of my chart below, which shows the slope of the 50 moving average (blue line), using the code above.
The trend line I drew says that the angle from the last point 50 bars back is 7.93º, so I would expect the "slope" indicator to show the same value for that last point in the chart but instead it says 0.393685.
Why??
Can anyone explain?
Thanks in advance

I've used the code in the thinkOrSwim reference page for ATan to calculate an angle:
Code:
declare lower;
input length = 50;
def avg = Average(close, length);
def height = avg - avg[length];
plot "Angle, deg" = ATan(height/length) * 180 / Double.Pi;
I created an indicator "slope" at the bottom of my chart below, which shows the slope of the 50 moving average (blue line), using the code above.
The trend line I drew says that the angle from the last point 50 bars back is 7.93º, so I would expect the "slope" indicator to show the same value for that last point in the chart but instead it says 0.393685.
Why??
Can anyone explain?
Thanks in advance
Last edited: