Hello,
This might be a stretch, but I'm a huge fan of the monkey bars.
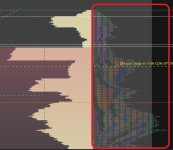
I don't know if its possible but I was wondering if the numbers of the profile can change colors to something more preferred.
The problem I'm having is difficult to see. If I do a white background I can't see the bright colors. If I do a black, Its hard to see the dark colors.
Is there any way the colors for numbers can be changed. Thanks.
I put in the default thinkscript code.
Heres a better picture about what I"m talking about

This might be a stretch, but I'm a huge fan of the monkey bars.
I don't know if its possible but I was wondering if the numbers of the profile can change colors to something more preferred.
The problem I'm having is difficult to see. If I do a white background I can't see the bright colors. If I do a black, Its hard to see the dark colors.
Is there any way the colors for numbers can be changed. Thanks.
I put in the default thinkscript code.
Code:
#
# TD Ameritrade IP Company, Inc. (c) 2010-2022
#

input pricePerRowHeightMode = {default AUTOMATIC, TICKSIZE, CUSTOM};
input customRowHeight = 1.0;
input aggregationPeriod = {"1 min", "2 min", "3 min", "4 min", "5 min", "10 min", "15 min", "20 min", default "30 min", "1 hour", "2 hours", "4 hours", "Day", "2 Days", "3 Days", "4 Days", "Week", "Month", "Quarter", "Year"};
input timePerProfile = {default CHART, MINUTE, HOUR, DAY, WEEK, MONTH, "OPT EXP", BAR, YEAR};
input multiplier = 1;
input onExpansion = yes;
input profiles = 1000;
input showMonkeyBar = yes;
input showThePlayground = yes;
input thePlaygroundPercent = 70;
input opacity = 100;
input emphasizeFirstDigit = no;
input markOpenPrice = yes;
input markClosePrice = yes;
input volumeShowStyle = MonkeyVolumeShowStyle.NONE;
input showVolumeVA = yes;
input showVolumePoc = yes;
input theVolumePercent = 70;
input showInitialBalance = yes;
input initialBalanceRange = 3;

def period;
def yyyymmdd = getYyyyMmDd();
def seconds = secondsFromTime(0);
def year = getYear();
def month = year * 12 + getMonth();
def day_number = daysFromDate(first(yyyymmdd)) + getDayOfWeek(first(yyyymmdd));
def dom = getDayOfMonth(yyyymmdd);
def dow = getDayOfWeek(yyyymmdd - dom + 1);
def expthismonth = (if dow > 5 then 27 else 20) - dow;
def exp_opt = month + (dom > expthismonth);
def periodMin = Floor(seconds / 60 + day_number * 24 * 60);
def periodHour = Floor(seconds / 3600 + day_number * 24);
def periodDay = countTradingDays(Min(first(yyyymmdd), yyyymmdd), yyyymmdd) - 1;
def periodWeek = Floor(day_number / 7);
def periodMonth = month - first(month);
def periodQuarter = Ceil(month / 3) - first(Ceil(month / 3));
def periodYear = year - first(year);

switch (timePerProfile) {
case CHART:
    period = 0;
case MINUTE:
    period = periodMin;
case HOUR:
    period = periodHour;
case DAY:
    period = periodDay;
case WEEK:
    period = periodWeek;
case MONTH:
    period = periodMonth;
case "OPT EXP":
    period = exp_opt - first(exp_opt);
case BAR:
    period = barNumber() - 1;
case YEAR:
    period = periodYear;
}

def count = compoundvalue(1, if period != period[1] then (getValue(count, 1) + period - period[1]) % multiplier else getValue(count, 1), 0);
def cond = compoundvalue(1, count < count[1] + period - period[1], yes);
def height;
switch (pricePerRowHeightMode) {
case AUTOMATIC:
    height = PricePerRow.AUTOMATIC;
case TICKSIZE:
    height = PricePerRow.TICKSIZE;
case CUSTOM:
    height = customRowHeight;
}

def timeInterval;
def aggMultiplier;
switch (aggregationPeriod) {
case "1 min":
    timeInterval = periodMin;
    aggMultiplier = 1;
case "2 min":
    timeInterval = periodMin;
    aggMultiplier = 2;
case "3 min":
    timeInterval = periodMin;
    aggMultiplier = 3;
case "4 min":
    timeInterval = periodMin;
    aggMultiplier = 4;
case "5 min":
    timeInterval = periodMin;
    aggMultiplier = 5;
case "10 min":
    timeInterval = periodMin;
    aggMultiplier = 10;
case "15 min":
    timeInterval = periodMin;
    aggMultiplier = 15;
case "20 min":
    timeInterval = periodMin;
    aggMultiplier = 20;
case "30 min":
    timeInterval = periodMin;
    aggMultiplier = 30;
case "1 hour":
    timeInterval = periodHour;
    aggMultiplier = 1;
case "2 hours":
    timeInterval = periodHour;
    aggMultiplier = 2;
case "4 hours":
    timeInterval = periodHour;
    aggMultiplier = 4;
case "Day":
    timeInterval = periodDay;
    aggMultiplier = 1;
case "2 Days":
    timeInterval = periodDay;
    aggMultiplier = 2;
case "3 Days":
    timeInterval = periodDay;
    aggMultiplier = 3;
case "4 Days":
    timeInterval = periodDay;
    aggMultiplier = 4;
case "Week":
    timeInterval = periodWeek;
    aggMultiplier = 1;
case "Month":
    timeInterval = periodMonth;
    aggMultiplier = 1;
case "Quarter":
    timeInterval = periodQuarter;
    aggMultiplier = 1;
case "Year":
    timeInterval = periodYear;
    aggMultiplier = 1;
}

def agg_count = compoundvalue(1, if timeInterval != timeInterval[1] then (getValue(agg_count, 1) + timeInterval - timeInterval[1]) % aggMultiplier else getValue(agg_count, 1), 0);
def agg_cond = compoundvalue(1,  agg_count < agg_count[1] + timeInterval - timeInterval[1], yes);

def digit = compoundValue(1, if cond then 1 else agg_cond + getValue(digit, 1), 1);

profile monkey = monkeyBars(digit, "startNewProfile" = cond, "onExpansion" = onExpansion,
"numberOfProfiles" = profiles, "pricePerRow" = height, "the playground percent" = thePlaygroundPercent,
"emphasize first digit" = emphasizeFirstDigit, "volumeProfileShowStyle" = volumeShowStyle, "volumePercentVA" = theVolumePercent,
 "show initial balance" = showInitialBalance, "initial balance range" = initialBalanceRange);
def con = compoundValue(1, onExpansion, no);
def mbar = compoundvalue(1, if IsNaN(monkey.getPointOfControl()) and con then getValue(mbar, 1) else monkey.getPointOfControl(), monkey.getPointOfControl());
def hPG = compoundvalue(1, if IsNaN(monkey.getHighestValueArea()) and con then getValue(hPG, 1) else monkey.getHighestValueArea(), monkey.getHighestValueArea());
def lPG = compoundvalue(1, if IsNaN(monkey.getLowestValueArea()) and con then getValue(lPG, 1) else monkey.getLowestValueArea(), monkey.getLowestValueArea());

def hProfile = compoundvalue(1, if IsNaN(monkey.getHighest()) and con then getValue(hProfile, 1) else monkey.getHighest(), monkey.getHighest());
def lProfile = compoundvalue(1, if IsNaN(monkey.getLowest()) and con then getValue(lProfile, 1) else monkey.getLowest(), monkey.getLowest());
def plotsDomain = IsNaN(close) == onExpansion;

plot MB = if plotsDomain then mbar else Double.NaN;
plot ProfileHigh = if plotsDomain then hProfile else Double.NaN;
plot ProfileLow = if plotsDomain then lProfile else Double.NaN;
plot PGHigh = if plotsDomain then hPG else Double.NaN;
plot PGLow = if plotsDomain then lPG else Double.NaN;

DefineGlobalColor("Monkey Bar", GetColor(4));
DefineGlobalColor("The Playground", GetColor(3));
DefineGlobalColor("Open Price", GetColor(1));
DefineGlobalColor("Close Price", GetColor(1));
DefineGlobalColor("Volume", GetColor(8));
DefineGlobalColor("Volume Value Area", GetColor(2));
DefineGlobalColor("Volume Point of Control", GetColor(3));
DefineGlobalColor("Initial Balance", GetColor(7));

monkey.show(color.red, if showMonkeyBar then globalColor("Monkey Bar") else color.current,
 if showThePlayground then globalColor("The Playground") else color.current,
 opacity, if markOpenPrice then globalColor("Open Price") else color.current,
 if markClosePrice then globalColor("Close Price") else color.current,
 if showInitialBalance then globalColor("Initial Balance") else color.current,
 globalColor("Volume"),
 if showVolumeVA then globalColor("Volume Value Area") else color.current,
 if showVolumePOC then globalColor("Volume Point of Control") else color.current);
MB.SetDefaultColor(globalColor("Monkey Bar"));
MB.SetPaintingStrategy(PaintingStrategy.HORIZONTAL);
PGHigh.SetPaintingStrategy(PaintingStrategy.HORIZONTAL);
PGLow.SetPaintingStrategy(PaintingStrategy.HORIZONTAL);
PGHigh.SetDefaultColor(globalColor("The Playground"));
PGLow.SetDefaultColor(globalColor("The Playground"));
ProfileHigh.SetPaintingStrategy(PaintingStrategy.HORIZONTAL);
ProfileLow.SetPaintingStrategy(PaintingStrategy.HORIZONTAL);
ProfileHigh.SetDefaultColor(GetColor(3));
ProfileLow.SetDefaultColor(GetColor(3));
ProfileHigh.hide();
ProfileLow.hide();
Heres a better picture about what I"m talking about
Last edited by a moderator: