
Author Message:
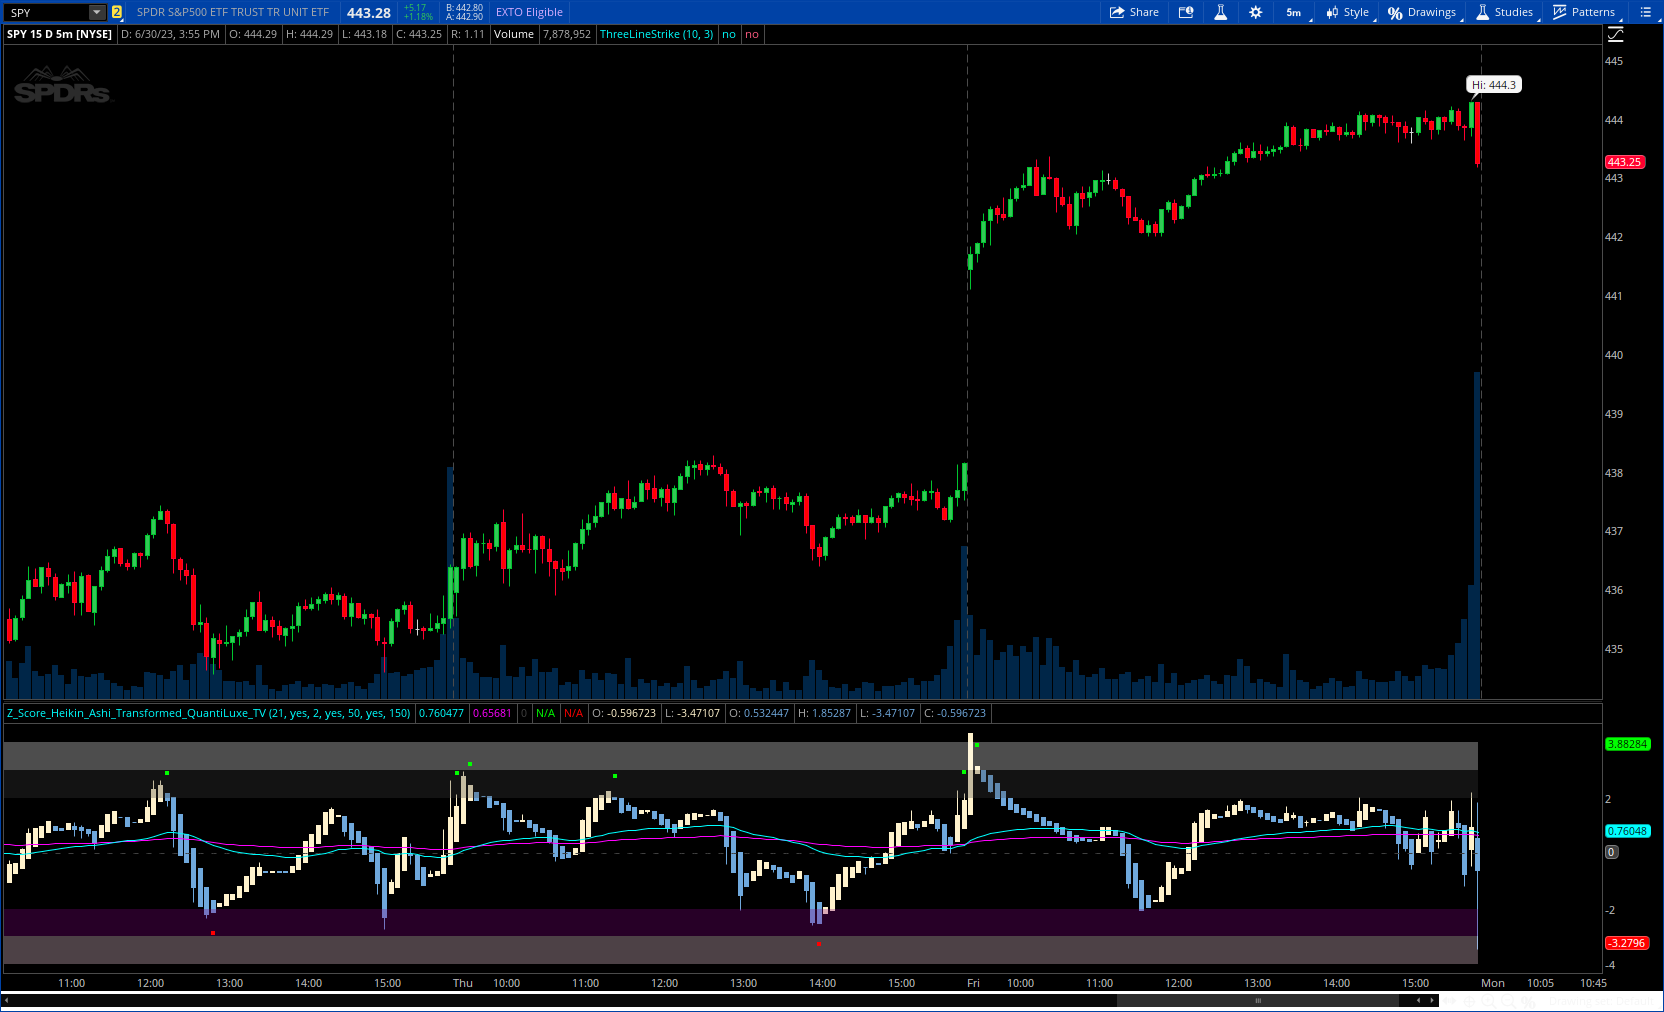
he Z-Score Heikin-Ashi Transformed (𝘡 𝘏-𝘈) indicator is a powerful technical tool that combines the principles of Z-Score and Heikin Ashi to provide traders with a smoothed representation of price movements and a standardized measure of market volatility.
The 𝘡 𝘏-𝘈 indicator applies the Z-Score calculation to price data and then transforms the resulting Z-Scores using the Heikin Ashi technique. Understanding the individual components of Z-Score and Heikin Ashi will provide a foundation for comprehending the methodology and unique features of this indicator.
More Details : https://www.tradingview.com/v/MFW8vsmU/
CODE:
CSS:
#// This source code is subject to the terms of the Mozilla Public License 2.0 at https://mozilla.org/MPL/2.0/
#https://www.tradingview.com/v/MFW8vsmU/
#// © QuantiLuxe
#indicator("Z-Score Heikin Ashi Transformed", "{?} - ? ?-?", false)
# converted by Sam4Cok@Samer800    - 07/2023
declare lower;
#f_z(src, len) =>
script f_z {
    input src = close;
    input len = 21;
    def mean = Average(src, len);
    def dev = StDev(src, len);
    def f_z = (src - mean) / dev;
    plot out = f_z;
}
input Zperiod = 21;            # 'Z Period'
input showSignals = yes;
input ReversionThreshold = {"1", default "2", "3"};    # "Reversion Threshold"
input showMovAvgLine1 = yes;
input movAvgLength1 = 50;
input showMovAvgLine2 = yes;
input movAvgLength2 = 150;

def na = Double.NaN;
def last = isNaN(close);

def revt;
Switch (ReversionThreshold) {
Case "1" : revt = 1;
Case "2" : revt = 2;
Case "3" : revt = 3;
}
#-- Colors
DefineGlobalColor("colup", CreateColor(255,242,204));
DefineGlobalColor("coldn", CreateColor(111,168,220));
DefineGlobalColor("colema1", Color.CYAN);
DefineGlobalColor("colema2", Color.MAGENTA);
DefineGlobalColor("low", CreateColor(255,214,232));
DefineGlobalColor("dlow", Color.PLUM);

def o_z = f_z(open, Zperiod);
def h_z = f_z(high, Zperiod);
def l_z = f_z(low, Zperiod);
def c_z = f_z(close, Zperiod);

def haClose = (o_z + h_z + l_z + c_z) / 4;
def haOpen = CompoundValue(1, (haOpen[1] + haClose[1]) / 2, (o_z + c_z) / 2);
def haHigh = Max(h_z, Max(haOpen, haClose));
def haLow = Min(l_z, Min(haOpen, haClose));
#def ohlc = (haClose + haOpen + haHigh + haLow) / 4;

def haColor = if haClose > haOpen then 1 else
              if haClose < haOpen then -1 else 0;
def OpenUp = if haColor > 0 then haOpen else na;
def OpenDn = if haColor < 0 then haOpen else na;

# Plot the new Chart
AddChart(high = if haColor > 0 then haHigh else na , low = haLow , open = haClose,  close = OpenUp,
         type = ChartType.CANDLE, growcolor =  GlobalColor("colup"));

AddChart(high = if haColor < 0 then haHigh else na, low = haLow , open = OpenDn,  close = haClose,
         type = ChartType.CANDLE, growcolor =  GlobalColor("coldn"));

plot EMA1 = if showMovAvgLine1 then ExpAverage(haClose, movAvgLength1) else na;
plot EMA2 = if showMovAvgLine2 then ExpAverage(haClose, movAvgLength2) else na;
EMA1.SetDefaultColor(GlobalColor("colema1"));
EMA2.SetDefaultColor(GlobalColor("colema2"));

plot zero = if last then na else 0;    # "Mid Line"
zero.SetStyle(Curve.SHORT_DASH);
zero.SetDefaultColor(Color.DARK_GRAY);

def max = if last then na else 4;
def hh = if last then na else 3;
def lh = if last then na else 2;

DefineGlobalColor("high", Color.DARK_GRAY);
DefineGlobalColor("dhigh", Color.WHITE);
AddCloud(hh, lh, GlobalColor("dhigh"));
AddCloud(max, hh, GlobalColor("high"));

def min = if last then na else -4;
def ll = if last then na else -3;
def hl = if last then na else -2;

AddCloud(hl, ll, GlobalColor("dlow"));
AddCloud(ll, min, GlobalColor("low"));

def dn = haHigh[1] < haHigh[2];
def up = haLow[1] > haLow[2];

plot SigUp = if !showSignals then na else
             if (haHigh > revt and haHigh < haHigh[1] and !dn) then haHigh + 0.75 else na;    # "OB"
plot SigDn = if !showSignals then na else
             if (haLow < -revt and haLow > haLow[1] and !up) then haLow - 0.75 else na;       # "OS"

SigUp.SetPaintingStrategy(PaintingStrategy.SQUARES);
SigDn.SetPaintingStrategy(PaintingStrategy.SQUARES);
SigUp.SetDefaultColor(Color.GREEN);
SigDn.SetDefaultColor(Color.RED);

#--- END of CODE
Last edited by a moderator:
 )the HeikinAshi transformed indicator can be used for both Time based and intraday Tick charts.. Congratulations . Gratitude from MagicQuotes. Best to all on the thread
