Gabrielx77
Active member
I hope it helps anyone who's looking for a new strategy when it comes to trading.
The reason why I was looking for a script for this Alligator Strategy was because I read into someone using it with great success; it seemed very easy to follow and very concise, even when I looked back at the previous entry and exit points from months ago.
Basically, with this strategy, you would wait until the 5 ma crosses under or over both the 8 ma and the 13 ma; but as you can see in my picture, you would've missed most of the move. After reading more into this strategy, I found someone who has found a solution for not having to miss the move.
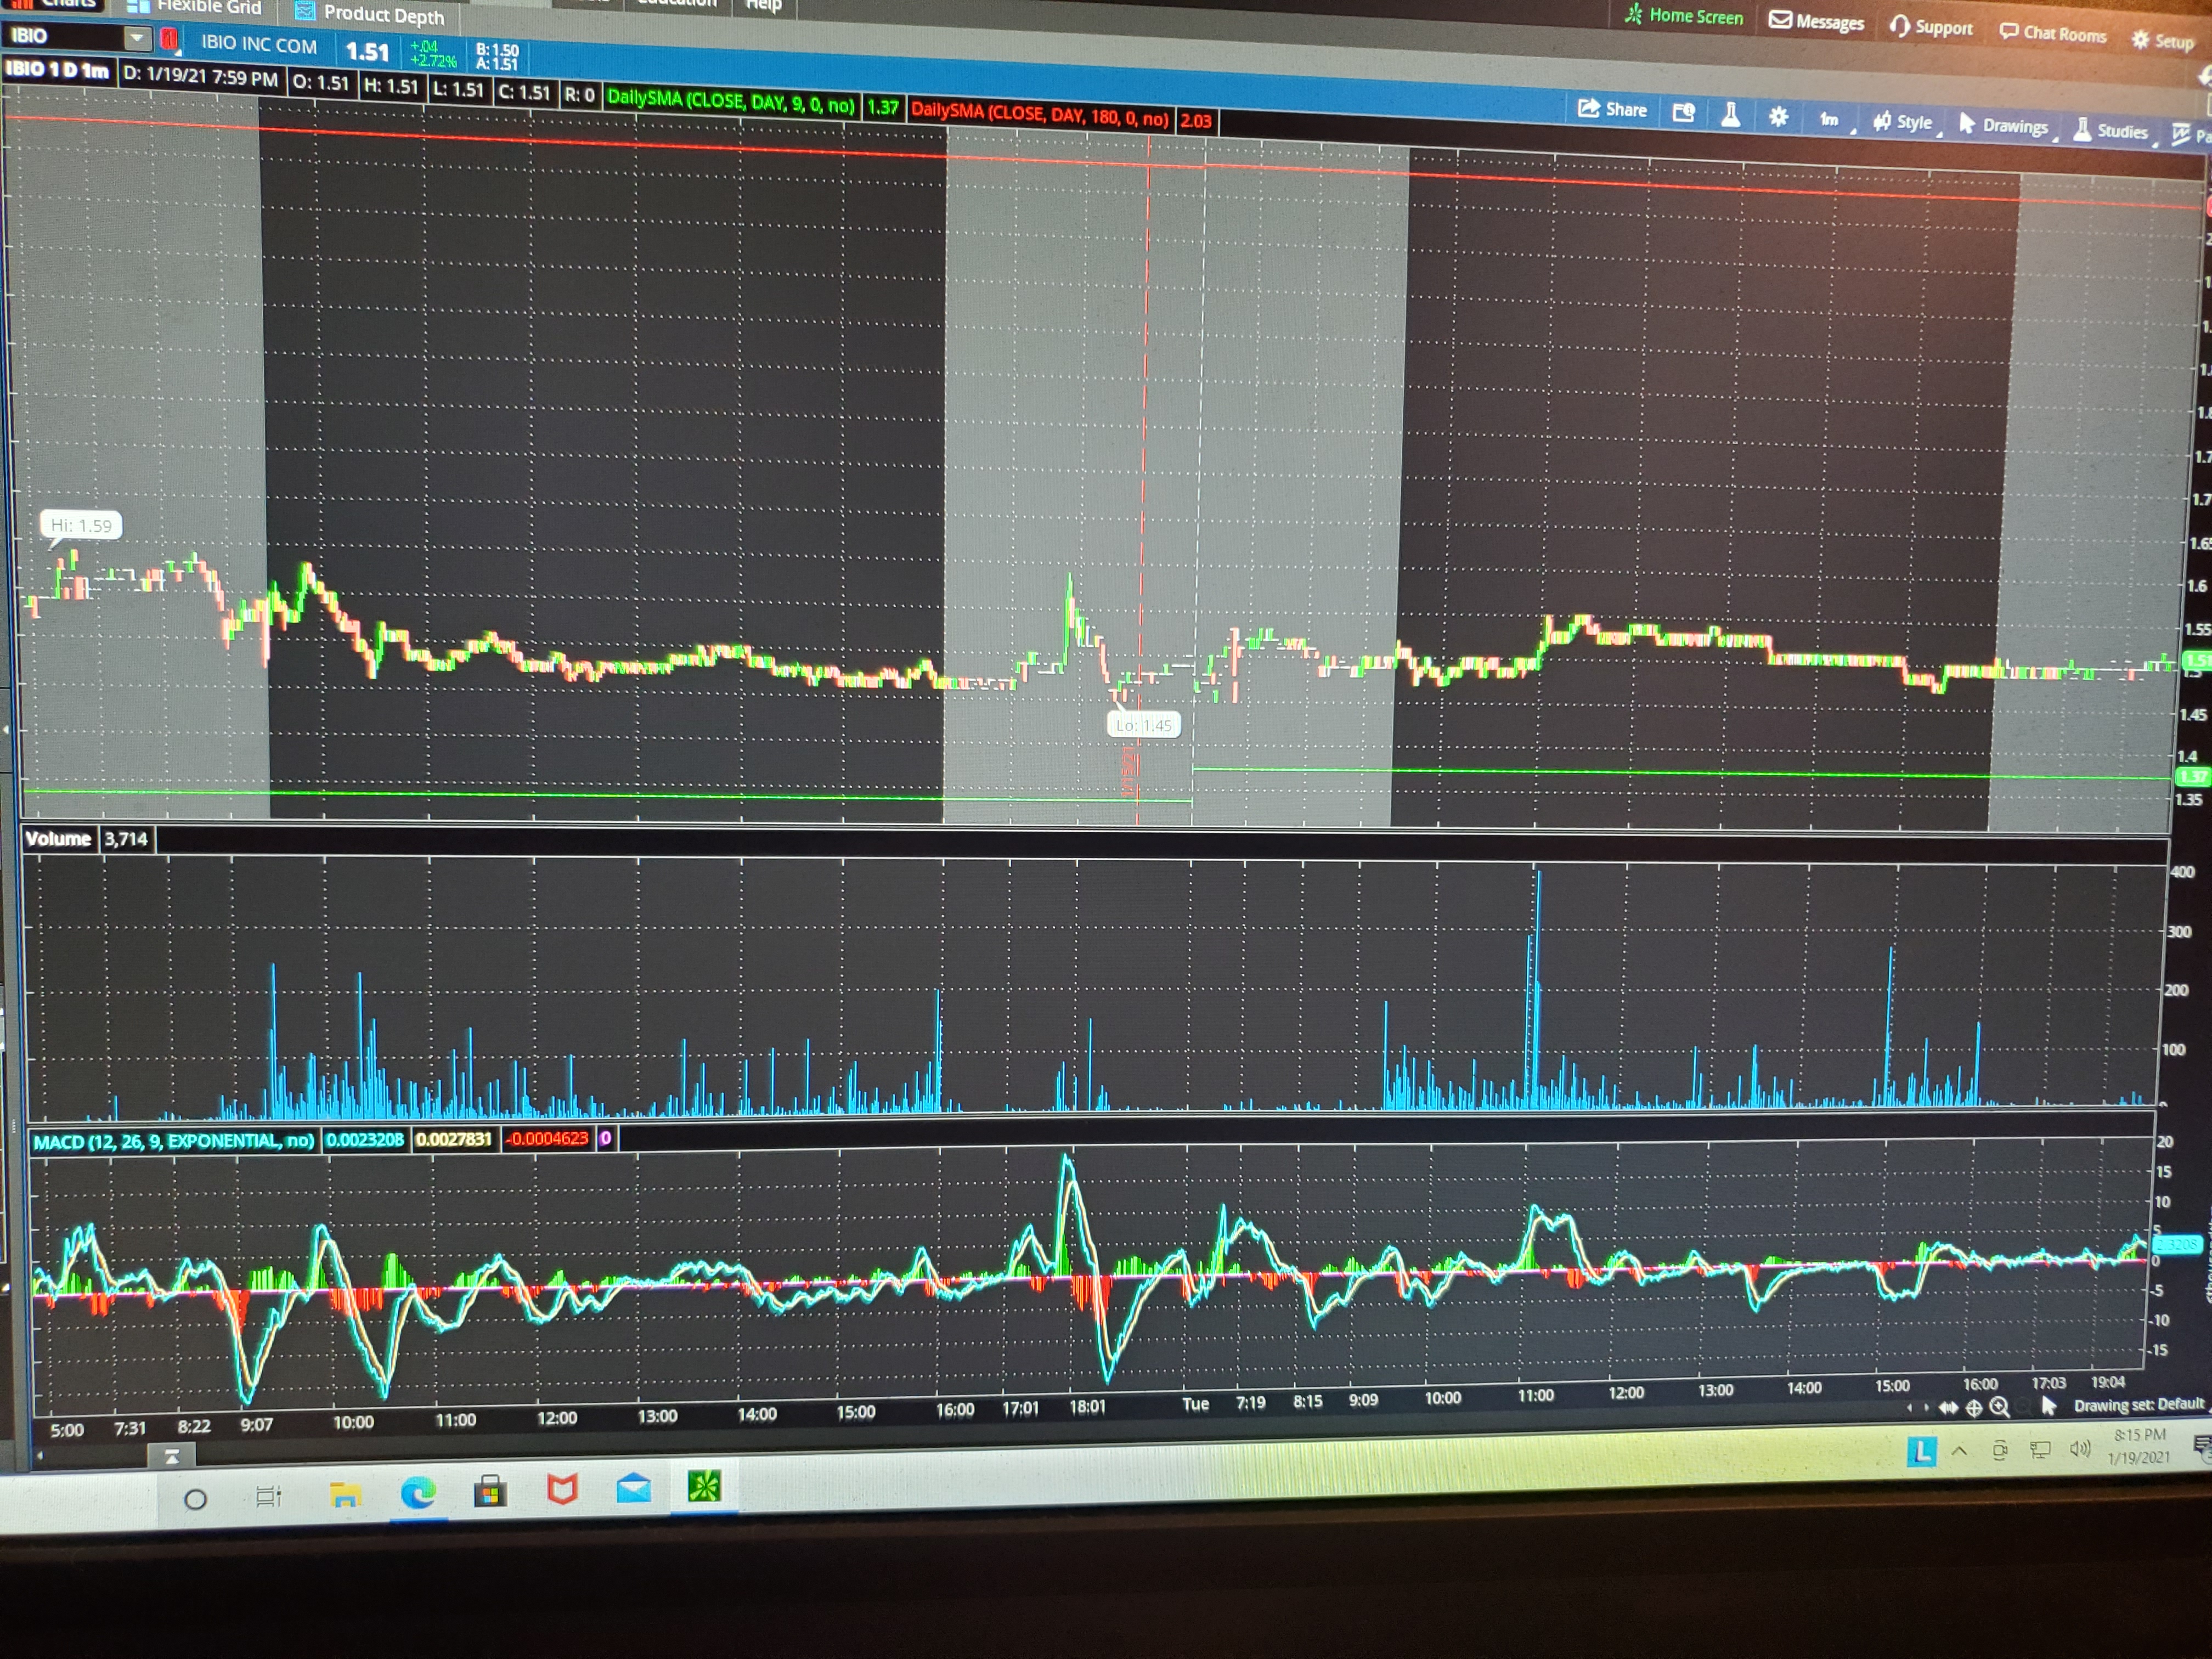
In the picture you will see:
1. 3 Smooth Moving Averages: 5 with -3 displacement (green) 8 with -5 displacement (red) and the 13 with a -8 displacement (blue)
2. Two Ovals: 1st one being my entry point and the 2nd being my exit point
3, Magenta Down Arrow: Representation for when the 5 ma crosses under both the 8 and 13 ma
As I said before, usually your entry point would be when the 3 moving averages cross, but you would miss most of the move; the exit would be when the candles close back into the moving averages (aka the gator).
To avoid the miss of the move, you would want to enter the trade when the candle crosses and closes above or below the whole gator instead. At the same time, you would need to make sure your MACD is following the trend of the candle. As you can see, the MACD is converging towards the down side, which means it's a strong signal and you can buy.
Traded options the other day on the SPY, and although the trade took up some time, the result was about a $125-$150 gain per contract.

I got this specific strategy from a user on reddit that goes by: rogerdog1 if anyone was wondering.
The reason why I was looking for a script for this Alligator Strategy was because I read into someone using it with great success; it seemed very easy to follow and very concise, even when I looked back at the previous entry and exit points from months ago.
Basically, with this strategy, you would wait until the 5 ma crosses under or over both the 8 ma and the 13 ma; but as you can see in my picture, you would've missed most of the move. After reading more into this strategy, I found someone who has found a solution for not having to miss the move.
In the picture you will see:
1. 3 Smooth Moving Averages: 5 with -3 displacement (green) 8 with -5 displacement (red) and the 13 with a -8 displacement (blue)
2. Two Ovals: 1st one being my entry point and the 2nd being my exit point
3, Magenta Down Arrow: Representation for when the 5 ma crosses under both the 8 and 13 ma
As I said before, usually your entry point would be when the 3 moving averages cross, but you would miss most of the move; the exit would be when the candles close back into the moving averages (aka the gator).
To avoid the miss of the move, you would want to enter the trade when the candle crosses and closes above or below the whole gator instead. At the same time, you would need to make sure your MACD is following the trend of the candle. As you can see, the MACD is converging towards the down side, which means it's a strong signal and you can buy.
Traded options the other day on the SPY, and although the trade took up some time, the result was about a $125-$150 gain per contract.
I got this specific strategy from a user on reddit that goes by: rogerdog1 if anyone was wondering.
Last edited by a moderator:
")