VWAP 9EMA Crossover Study

BullPride2020

New member
Hello,

I'm looking for a ThinkScript VWAP 9EMA Crossover study on this website that shows a signal when the 9EMA crosses above or below VWAP. Does anyone know where I can find this or the shareable link for this type of study? Thank you
 
Solution
This is something i found in this forum. I couldn't find the link, but here is the code.

Code:
#Hint: EMA9 crosses above VWAP
# By BenTen of useThinkScript.com

declare upper;
input alerts = yes;

# Moving Average
input priceMA = close;
input lengthMA = 9;
input displace = 0;
input showBreakoutSignals = yes;
input price = close;

def EMA = ExpAverage(priceMA[-displace], lengthMA);

# VWAP
input numDevDn = -2.0;
input numDevUp = 2.0;
input timeFrame = {default DAY, WEEK, MONTH};

def cap = GetAggregationPeriod();
def errorInAggregation =
    timeFrame == timeFrame.DAY and cap >= AggregationPeriod.WEEK or
    timeFrame == timeFrame.WEEK and cap >= AggregationPeriod.MONTH;
Assert(!errorInAggregation, "timeFrame should be not less than...
This is something i found in this forum. I couldn't find the link, but here is the code.

Code:
#Hint: EMA9 crosses above VWAP
# By BenTen of useThinkScript.com

declare upper;
input alerts = yes;

# Moving Average
input priceMA = close;
input lengthMA = 9;
input displace = 0;
input showBreakoutSignals = yes;
input price = close;

def EMA = ExpAverage(priceMA[-displace], lengthMA);

# VWAP
input numDevDn = -2.0;
input numDevUp = 2.0;
input timeFrame = {default DAY, WEEK, MONTH};

def cap = GetAggregationPeriod();
def errorInAggregation =
    timeFrame == timeFrame.DAY and cap >= AggregationPeriod.WEEK or
    timeFrame == timeFrame.WEEK and cap >= AggregationPeriod.MONTH;
Assert(!errorInAggregation, "timeFrame should be not less than current chart aggregation period");

def yyyyMmDd = GetYYYYMMDD();
def periodIndx;
switch (timeFrame) {
case DAY:
    periodIndx = yyyyMmDd;
case WEEK:
    periodIndx = Floor((DaysFromDate(First(yyyyMmDd)) + GetDayOfWeek(First(yyyyMmDd))) / 7);
case MONTH:
    periodIndx = RoundDown(yyyyMmDd / 100, 0);
}
def isPeriodRolled = CompoundValue(1, periodIndx != periodIndx[1], yes);

def volumeSum;
def volumeVwapSum;
def volumeVwap2Sum;

if (isPeriodRolled) {
    volumeSum = volume;
    volumeVwapSum = volume * vwap;
    volumeVwap2Sum = volume * Sqr(vwap);
} else {
    volumeSum = CompoundValue(1, volumeSum[1] + volume, volume);
    volumeVwapSum = CompoundValue(1, volumeVwapSum[1] + volume * vwap, volume * vwap);
    volumeVwap2Sum = CompoundValue(1, volumeVwap2Sum[1] + volume * Sqr(vwap), volume * Sqr(vwap));
}
def priceVWAP = volumeVwapSum / volumeSum;
def deviation = Sqrt(Max(volumeVwap2Sum / volumeSum - Sqr(priceVWAP), 0));

def VWAP = priceVWAP;

def bullish_signal = EMA crosses above priceVWAP;
def bearish_signal = EMA crosses below priceVWAP;

# Plot Signals
plot bullish = bullish_signal;
bullish.SetPaintingStrategy(PaintingStrategy.BOOLEAN_ARROW_UP);
bullish.SetDefaultColor(Color.CYAN);
bullish.SetLineWeight(3);

plot bearish = bearish_signal;
bearish.SetPaintingStrategy(PaintingStrategy.BOOLEAN_ARROW_DOWN);
bearish.SetDefaultColor(Color.CYAN);
bearish.SetLineWeight(3);

# alerts
Alert(alerts and (bullish_signal or bearish_signal), if bullish_signal then "UP" else "DN", Alert.BAR, Sound.bell);
 
Last edited by a moderator:
Solution
Can this be added please

@BenTen can you also provide toggle button options where the code can be EMA as well as SMA please


input length_10 = 10;
input length_20 = 20;
input length_50 = 50;
input length_200 = 200;

def dailyClose = close(period = "DAY");
plot dma10 = Average(dailyClose, length_10);
plot dma20 = Average(dailyClose, length_20);
plot dma50 = Average(dailyClose, length_50);
plot dma200 = Average(dailyClose, length_200);

dma10.SetDefaultColor(GetColor(1));
dma20.SetDefaultColor(GetColor(2));
dma50.SetDefaultColor(GetColor(3));
dma200.SetDefaultColor(GetColor(4));
 

Attachments

  • SYNC2.png
    SYNC2.png
    23.7 KB · Views: 61
Last edited by a moderator:
@BenTen can you also provide toggle button options where the code can be EMA as well as SMA please


input length_10 = 10;
input length_20 = 20;
input length_50 = 50;
input length_200 = 200;

def dailyClose = close(period = "DAY");
plot dma10 = Average(dailyClose, length_10);
plot dma20 = Average(dailyClose, length_20);
plot dma50 = Average(dailyClose, length_50);
plot dma200 = Average(dailyClose, length_200);

dma10.SetDefaultColor(GetColor(1));
dma20.SetDefaultColor(GetColor(2));
dma50.SetDefaultColor(GetColor(3));
dma200.SetDefaultColor(GetColor(4));

Here you go

Code:
input length_10 = 10;
input length_20 = 20;
input length_50 = 50;
input length_200 = 200;
input EMA = yes;

def dailyClose = close(period = "DAY");
plot dma10 = if EMA then ExpAverage(dailyClose, length_10) else SimpleMovingAvg(dailyClose, length_10);
plot dma20 = if EMA then ExpAverage(dailyClose, length_20) else SimpleMovingAvg(dailyClose, length_20);
plot dma50 = if EMA then ExpAverage(dailyClose, length_50) else SimpleMovingAvg(dailyClose, length_50);
plot dma200 = if EMA then ExpAverage(dailyClose, length_200) else SimpleMovingAvg(dailyClose, length_200);

dma10.SetDefaultColor(GetColor(1));
dma20.SetDefaultColor(GetColor(2));
dma50.SetDefaultColor(GetColor(3));
dma200.SetDefaultColor(GetColor(4));
Thank you @BenTen
But this did not plot anything or even show any EMA on the chart...lol
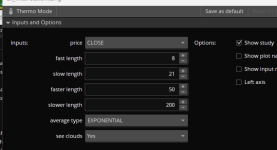
Can you please add alert and an option to select average types.
 
Please can this alert/show arrow lines only for 3 and 4 conditions only

see request pls

missing signal, displace and the different average types

Can you create a new chart and test the script again? It worked for me.

View attachment 24238
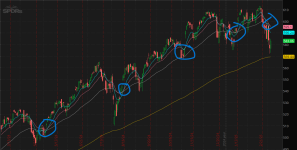
@BenTen - here is the screenhot results it gave me - different from yours -
1741330782033.png
 

Attachments

  • EMA LINES-.png
    EMA LINES-.png
    141 KB · Views: 65
  • Exponential - 1.jpg
    Exponential - 1.jpg
    126.6 KB · Views: 72
  • Exponential - 1.png
    Exponential - 1.png
    432.5 KB · Views: 58
Please can this alert/show arrow lines only for 3 and 4 conditions only

see request pls

missing signal, displace and the different average types


@BenTen - here is the screenhot results it gave me - different from yours - View attachment 24245

That's because you are using an MTF indicator. That indicator uses data from the daily timeframe. And you're using the lower timeframe (5 min), that's why it's like that. I recommend you understand the indicator first.

If you switch to the DAY timeframe, yours will look like mine.

If your goal is to use multiple moving averages, I recommend checking this indicator https://usethinkscript.com/threads/3-in-1-simple-or-exponential-moving-average-for-thinkorswim.64/
 

Join useThinkScript to post your question to a community of 21,000+ developers and traders.

Similar threads

Not the exact question you're looking for?

Start a new thread and receive assistance from our community.

87k+ Posts
433 Online
Create Post

Similar threads

Similar threads

The Market Trading Game Changer

Join 2,500+ subscribers inside the useThinkScript VIP Membership Club
  • Exclusive indicators
  • Proven strategies & setups
  • Private Discord community
  • ‘Buy The Dip’ signal alerts
  • Exclusive members-only content
  • Add-ons and resources
  • 1 full year of unlimited support

Frequently Asked Questions

What is useThinkScript?

useThinkScript is the #1 community of stock market investors using indicators and other tools to power their trading strategies. Traders of all skill levels use our forums to learn about scripting and indicators, help each other, and discover new ways to gain an edge in the markets.

How do I get started?

We get it. Our forum can be intimidating, if not overwhelming. With thousands of topics, tens of thousands of posts, our community has created an incredibly deep knowledge base for stock traders. No one can ever exhaust every resource provided on our site.

If you are new, or just looking for guidance, here are some helpful links to get you started.

What are the benefits of VIP Membership?
VIP members get exclusive access to these proven and tested premium indicators: Buy the Dip, Advanced Market Moves 2.0, Take Profit, and Volatility Trading Range. In addition, VIP members get access to over 50 VIP-only custom indicators, add-ons, and strategies, private VIP-only forums, private Discord channel to discuss trades and strategies in real-time, customer support, trade alerts, and much more. Learn all about VIP membership here.
How can I access the premium indicators?
To access the premium indicators, which are plug and play ready, sign up for VIP membership here.
Back
Top