
Drawing the zones from the candle with respect to higher volume on 30 minutes candle on each day upto 5 days back(act as support and resistance) !!!!!
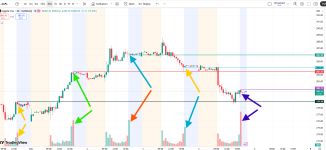
Hello there, disregard the platform, that i am showing here in the screenshot, however i want to draw a zones from each day 30 minutes max volume on the chart , which act as the support or resistance for the future day.
In this screenshot i am vewing the 30 minutes chart where we can see in each day there is the highest volume bar, now with respect to that highest volume bar i want to draw zones on the candle . if the highest volume bar is Green then i want to create a zone on the candle from open to low of the candle however if the highest volume bar is Red then i want to draw a zone from high to open.
Disregard the tradingview chart, however i want thinkscript code for it.. @halcyonguy @members
Thank you in advance.
Attachments
Last edited by a moderator: