


Uptrick: Vector Trail Trend (VTT)
Converted and modified:
Original concept: https://www.tradingview.com/script/5X9BnuD4-Uptrick-Vector-Trail-Trend/
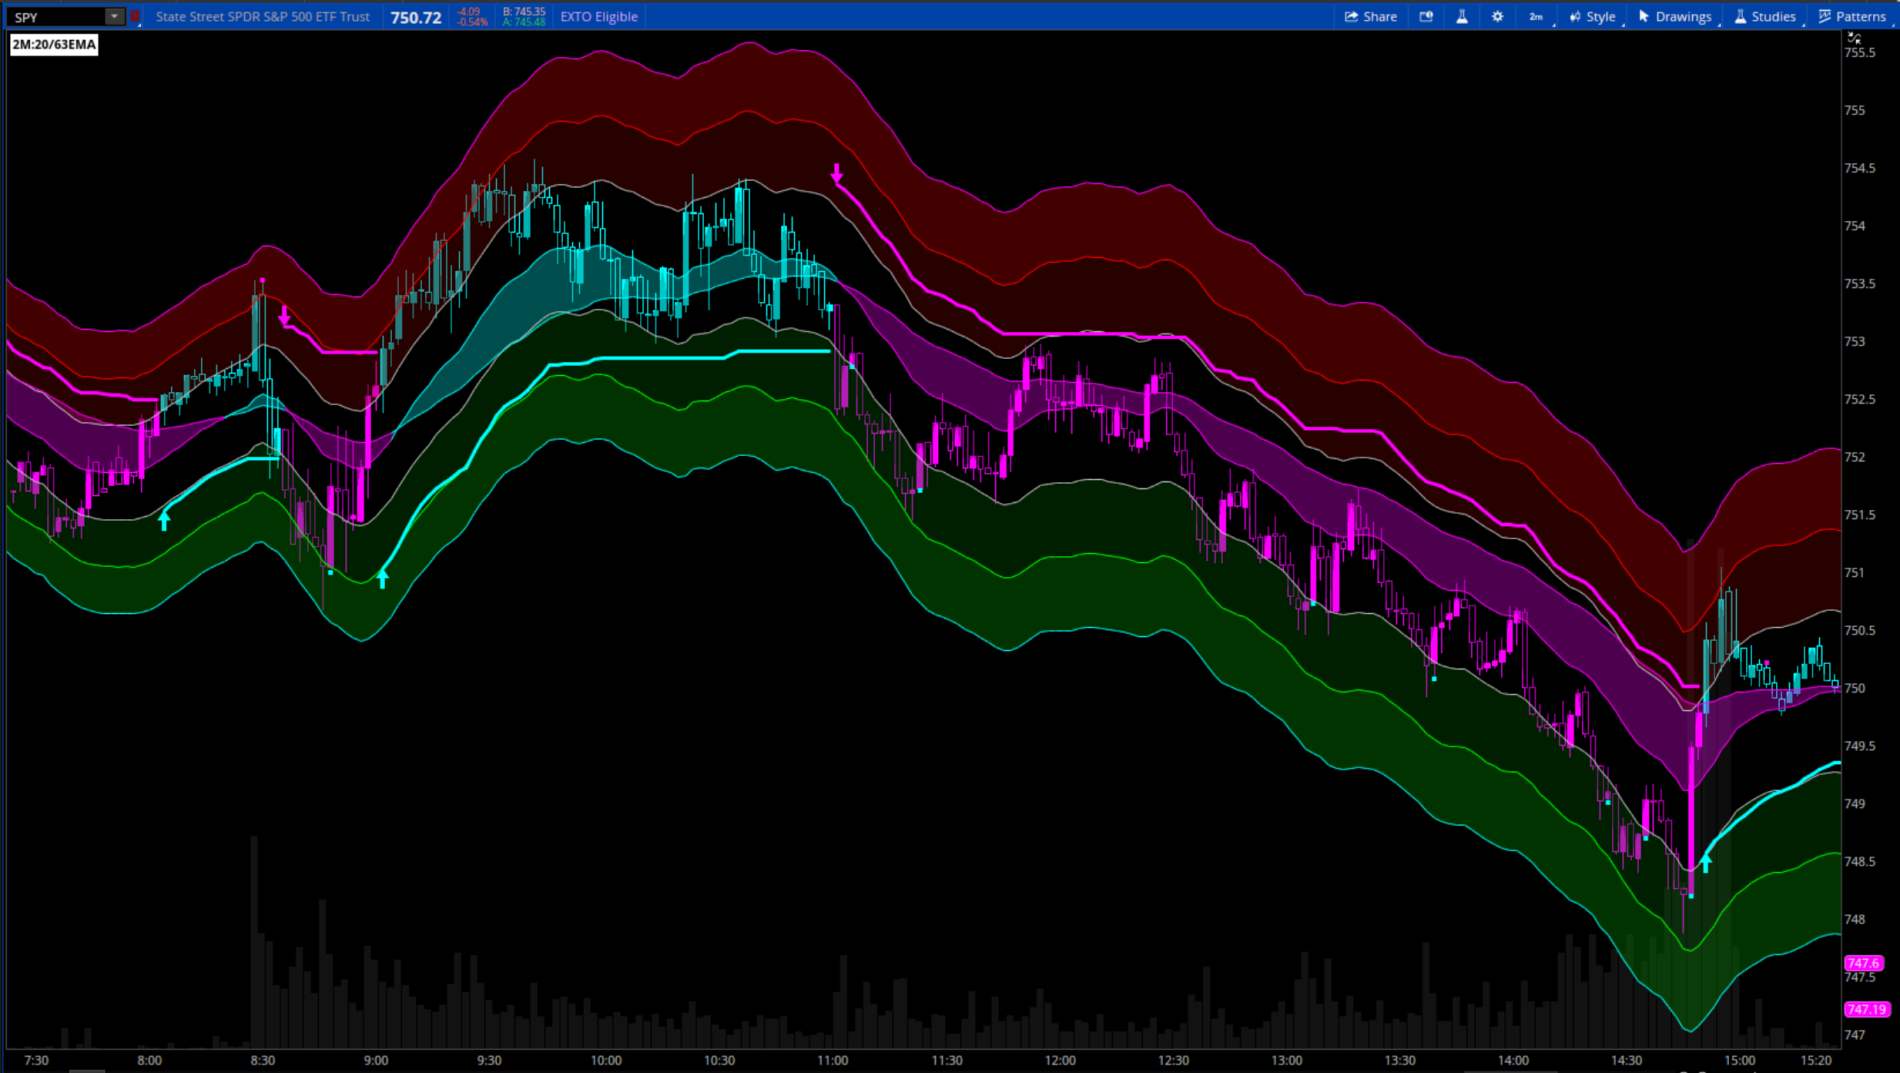
This indicator shows overall trend, plots points where trend is weakening, and bands where price is extended with a likelihood of a reversal. Many of the visual features are inputs and can be turned on/off in the settings.
Here is a 2min chart of SPY. Cyan bars are in an uptrend, magenta bars are in a downtrend.
Treat the trail line itself as a moving stop-loss level. Because it only tightens (never loosens) until the trend flips, it's built to be used the same way a chandelier stop is: exit or tighten risk if price closes through it, rather than trying to predict the flip in advance.
Use the Dynamic TP markers as a “take some off the table” flag, not an exit-everything signal. They fire when momentum has stretched to an extreme and is rolling over — historically a decent spot to trim a position or tighten a stop, especially if it lines up with the outer volatility bands. It does not mean the trend itself has reversed; the trail/ribbon still tell you when that happens.
Use the volatility bands to gauge how “expensive” a move already is. Price pressing into the outer band tier (bandMult3) means the move is far outside its typical longer-run range — often a lower-probability spot to be initiating new trend-following entries, and a more reasonable spot to be taking profit if you're already in the trade.
The best-aligned setups tend to be: trail flips direction → ribbon confirms same direction → price is not already sitting at the outer band tier. That combination avoids chasing a move that's already stretched.
This is a trend/momentum tool, not a reversal-picking tool. It's built to identify and ride a trend once one is underway, and to flag when momentum is getting stretched — it isn't designed to call tops/bottoms in a ranging or choppy market. Expect more false flips and TP noise in low-trend, sideways conditions.
Converted and modified:
Original concept: https://www.tradingview.com/script/5X9BnuD4-Uptrick-Vector-Trail-Trend/
This indicator shows overall trend, plots points where trend is weakening, and bands where price is extended with a likelihood of a reversal. Many of the visual features are inputs and can be turned on/off in the settings.
Here is a 2min chart of SPY. Cyan bars are in an uptrend, magenta bars are in a downtrend.
Overview
VTT is a trend-following overlay built around a smoothed, velocity-projected moving average (the “Vector Trend Engine”), wrapped in an ATR-based volatility trail that flips between support and resistance as the trend changes. Layered on top are a secondary trend-confirmation ribbon, a momentum-based take-profit signal, and a set of graduated volatility bands that frame the broader move. The goal is to give a trader one glance at: direction, confirmation, and how stretched the move currently is.Core Components
1. Vector Trend Engine
An EMA of price (trendLength) is projected forward using its own smoothed rate of change (velocityLength, projection), producing a trend line that leans slightly ahead of a standard moving average rather than lagging behind it.2. Adaptive Vector Trail
An ATR envelope (atrLength, atrMultiplier) is built around the trend vector. The upper and lower bounds each only move in the direction that tightens the stop — never loosen — until price closes through the opposite side, at which point the trend flips. This is the same mechanical idea as a chandelier exit / SuperTrend-style stop, and it's what produces the single colored trail line hugging price: cyan below price in an uptrend, magenta above price in a downtrend.3. Trend Ribbon
Two EMAs (ribbonFastLength, ribbonSlowLength) shaded between them, colored by whether the fast EMA is above or below the slow one. This is a slower-moving, secondary confirmation of trend direction — useful for filtering the faster trail signal.4. Dynamic TP Engine
Wilder's RSI on the momentum length (momentumLength) is normalized into a Z-score (zScoreLength) against its own recent history. When that Z-score reaches an extreme (tpExtremeLevel) and then rolls back through it, a TP marker (cross or circle, tpMarker) prints — flagging that momentum got stretched and is now cooling off, independent of the trend line itself flipping.5. Volatility Bands
A long-period ATR (bandAtrPeriod, default 200 bars) is used to draw three tiers of bands (bandMult1/2/3) above and below the ribbon's fast line, with shaded zones between the outer tiers. These act as a broader volatility map — where has price gone relative to its own longer-run typical range — independent of the shorter-term trend/trail mechanics above.Signals
| Element | Meaning |
| Cyan trail below price | Confirmed uptrend; trail acts as a trailing support / stop level |
| Magenta trail above price | Confirmed downtrend; trail acts as a trailing resistance / stop level |
| "Up" / "Down" arrow | Trend just flipped this bar |
| TP cross / circle | Momentum Z-score just rolled back from an extreme — a “stretched move cooling off” flag |
| Ribbon cloud color | Secondary trend confirmation (fast vs. slow EMA) |
| Outer volatility bands | How far price has traveled relative to its longer-run typical range |
Trade Tips
Use the trail as your directional bias, not a standalone entry trigger. A cyan trail means the mechanical trend is up; a magenta trail means it's down. Many traders treat a fresh Up/Down arrow as the earliest “something changed” signal, but confirm with the ribbon cloud color before acting — when trail and ribbon agree, the trend read is stronger.Treat the trail line itself as a moving stop-loss level. Because it only tightens (never loosens) until the trend flips, it's built to be used the same way a chandelier stop is: exit or tighten risk if price closes through it, rather than trying to predict the flip in advance.
Use the Dynamic TP markers as a “take some off the table” flag, not an exit-everything signal. They fire when momentum has stretched to an extreme and is rolling over — historically a decent spot to trim a position or tighten a stop, especially if it lines up with the outer volatility bands. It does not mean the trend itself has reversed; the trail/ribbon still tell you when that happens.
Use the volatility bands to gauge how “expensive” a move already is. Price pressing into the outer band tier (bandMult3) means the move is far outside its typical longer-run range — often a lower-probability spot to be initiating new trend-following entries, and a more reasonable spot to be taking profit if you're already in the trade.
The best-aligned setups tend to be: trail flips direction → ribbon confirms same direction → price is not already sitting at the outer band tier. That combination avoids chasing a move that's already stretched.
This is a trend/momentum tool, not a reversal-picking tool. It's built to identify and ride a trend once one is underway, and to flag when momentum is getting stretched — it isn't designed to call tops/bottoms in a ranging or choppy market. Expect more false flips and TP noise in low-trend, sideways conditions.
Code:
# Uptrick_Vector_Trail_Trend (VTT)
# Original concept:  https://www.tradingview.com/script/5X9BnuD4-Uptrick-Vector-Trail-Trend/
# Converted and modified by Chewie 7/16/2026

declare upper;

#-- Visuals ----------------------------------------------------------------
input showSignals  = yes;
input showbands    = yes;
input cloud        = no;
input colorCandles = yes;
input overlayMode = {default Both, VectorGradient, TrendRibbon, None};

#-- Trend Settings -----------------------------------------------------
input trendLength    = 34;
input velocityLength = 8;
input projection     = 3.0;

#-- Trail Settings ------------------------------------------------------
input atrLength = 14;
input atrMultiplier = 1.8;

#-- Dynamic TP Settings --------------------------------------------------
input showDynamicTp = yes;
input tpMarker = {default Cross, Circle};
input momentumLength = 14;
input zScoreLength = 50;
input tpExtremeLevel = 1.5;

#-- Overlay --------------------------------------------------------------
input ribbonFastLength = 21;
input ribbonSlowLength = 50;
input trailWidth = 3;

#-- Colors ---------------------------------------------------------------
DefineGlobalColor("Bullish", Color.CYAN);
DefineGlobalColor("Bearish", Color.MAGENTA);

#-- Source ------------------------------------------------------------------
def source = (high + low + close) / 3;

#-- Vector Trend Engine -------------------------------------------------
def trendCenter = ExpAverage(source, trendLength);
def trendVelocity = ExpAverage(trendCenter - trendCenter[1], velocityLength);
def trendVector = trendCenter + trendVelocity * projection;

#-- Adaptive Vector Trails ------------------------------------------------
def tr = TrueRange(high, close, low);
def atrValue = WildersAverage(tr, atrLength);
def safeAtr = if atrValue != 0 then atrValue else TickSize();

def basicUpper = trendVector + safeAtr * atrMultiplier;
def basicLower = trendVector - safeAtr * atrMultiplier;

def upperTrail = CompoundValue(1,
    if basicUpper < upperTrail[1] or close[1] > upperTrail[1]
    then basicUpper
    else upperTrail[1],
    basicUpper);

def lowerTrail = CompoundValue(1,
    if basicLower > lowerTrail[1] or close[1] < lowerTrail[1]
    then basicLower
    else lowerTrail[1],
    basicLower);

#-- Confirmed Trend State -------------------------------------------------
def trend = CompoundValue(1,
    if trend[1] == -1 and close > upperTrail[1]
    then 1
    else if trend[1] == 1 and close < lowerTrail[1]
    then -1
    else trend[1],
    1);

def bullish = trend == 1;
def bearish = trend == -1;

def upSignal = bullish and trend[1] == -1;
def downSignal = bearish and trend[1] == 1;

def activeTrail = if bullish then lowerTrail else upperTrail;

#-- Dynamic TP Engine (Wilder's RSI reimplemented, then Z-Scored) ----------
def netChg = source - source[1];
def netChgAvg = WildersAverage(netChg, momentumLength);
def netChgAvgAbs = WildersAverage(AbsValue(netChg), momentumLength);
def momentumValue = if netChgAvgAbs != 0 then 50 * (netChgAvg / netChgAvgAbs + 1) else 50;

def momentumBasis = Average(momentumValue, zScoreLength);
def momentumDeviation = StandardDeviation(momentumValue, zScoreLength);
def safeMomentumDeviation = if momentumDeviation != 0 then momentumDeviation else 1;
def momentumZScore = (momentumValue - momentumBasis) / safeMomentumDeviation;

def longTpArmed = bullish and momentumZScore >= tpExtremeLevel;
def shortTpArmed = bearish and momentumZScore <= -tpExtremeLevel;

def longTpSignal = showDynamicTp and bullish
    and momentumZScore[1] >= tpExtremeLevel and momentumZScore < tpExtremeLevel;
def shortTpSignal = showDynamicTp and bearish
    and momentumZScore[1] <= -tpExtremeLevel and momentumZScore > -tpExtremeLevel;

#-- Overlay Modes -----------------------------------------------------------
def showVectorGradient = overlayMode == overlayMode.VectorGradient or overlayMode == overlayMode.Both;
def showTrendRibbon = overlayMode == overlayMode.TrendRibbon or overlayMode == overlayMode.Both;

#-- Outer Vector Trails ------------------------------------------------------
plot BullTrail = if showVectorGradient and bullish then lowerTrail else Double.NaN;
BullTrail.SetDefaultColor(GlobalColor("Bullish"));
BullTrail.SetLineWeight(trailWidth);
BullTrail.SetPaintingStrategy(PaintingStrategy.LINE);

plot BearTrail = if showVectorGradient and bearish then upperTrail else Double.NaN;
BearTrail.SetDefaultColor(GlobalColor("Bearish"));
BearTrail.SetLineWeight(trailWidth);
BearTrail.SetPaintingStrategy(PaintingStrategy.LINE);

#-- Vector Gradient Overlay (hidden anchors + cloud) -------------------------
plot BullAnchor = if showVectorGradient and bullish then close else Double.NaN;
BullAnchor.Hide();

plot BearAnchor = if showVectorGradient and bearish then close else Double.NaN;
BearAnchor.Hide();

AddCloud(BullAnchor, BullTrail,  if cloud then GlobalColor("Bullish") else Color.CURRENT, Color.CURRENT);
AddCloud(BearAnchor, BearTrail, Color.CURRENT, if cloud then GlobalColor("Bearish") else Color.CURRENT);
#-- Trend Ribbon Overlay -----------------------------------------------------
def ribbonFastVal = ExpAverage(source, ribbonFastLength);
def ribbonSlowVal = ExpAverage(source, ribbonSlowLength);
def ribbonBullish = ribbonFastVal >= ribbonSlowVal;

plot RibbonFast = if showTrendRibbon then ribbonFastVal else Double.NaN;
RibbonFast.AssignValueColor(if ribbonBullish then GlobalColor("Bullish") else GlobalColor("Bearish"));
RibbonFast.SetLineWeight(1);

plot RibbonSlow = if showTrendRibbon then ribbonSlowVal else Double.NaN;
RibbonSlow.AssignValueColor(if ribbonBullish then GlobalColor("Bullish") else GlobalColor("Bearish"));
RibbonSlow.SetLineWeight(1);

AddCloud(RibbonFast, RibbonSlow, GlobalColor("Bullish"), GlobalColor("Bearish"));

#-- Up / Down Signal Labels ---------------------------------------------------
plot UpArrow = if showSignals and upSignal then lowerTrail else Double.NaN;
UpArrow.SetPaintingStrategy(PaintingStrategy.ARROW_UP);
UpArrow.SetDefaultColor(GlobalColor("Bullish"));
UpArrow.SetLineWeight(3);

plot DownArrow = if showSignals and downSignal then upperTrail else Double.NaN;
DownArrow.SetPaintingStrategy(PaintingStrategy.ARROW_DOWN);
DownArrow.SetDefaultColor(GlobalColor("Bearish"));
DownArrow.SetLineWeight(3);

#-- Dynamic TP Markers ---------------------------------------------------------
plot LongTpCross = if tpMarker == tpMarker.Cross and longTpSignal then high else Double.NaN;
LongTpCross.SetPaintingStrategy(PaintingStrategy.SQUARES);
LongTpCross.SetDefaultColor(GlobalColor("Bearish"));

plot ShortTpCross = if tpMarker == tpMarker.Cross and shortTpSignal then low else Double.NaN;
ShortTpCross.SetPaintingStrategy(PaintingStrategy.SQUARES);
ShortTpCross.SetDefaultColor(GlobalColor("Bullish"));

plot LongTpCircle = if tpMarker == tpMarker.Circle and longTpSignal then high else Double.NaN;
LongTpCircle.SetPaintingStrategy(PaintingStrategy.POINTS);
LongTpCircle.SetLineWeight(3);
LongTpCircle.SetDefaultColor(GlobalColor("Bearish"));

plot ShortTpCircle = if tpMarker == tpMarker.Circle and shortTpSignal then low else Double.NaN;
ShortTpCircle.SetPaintingStrategy(PaintingStrategy.POINTS);
ShortTpCircle.SetLineWeight(3);
ShortTpCircle.SetDefaultColor(GlobalColor("Bullish"));

#-- Candle Coloring -------------------------------------------------------------
AssignPriceColor(if colorCandles then (if bullish then GlobalColor("Bullish") else GlobalColor("Bearish")) else Color.CURRENT);

##-- BANDS -------------------------------------------------------------
input bandAtrPeriod = 200;
input bandMult1     = 2.0;
input bandMult2     = 4.0;
input bandMult3     = 6.0;

def bATR = ATR(bandAtrPeriod);

plot Band1Up = if showBands then RibbonFast + bATR * bandMult1 else Double.NaN;
plot Band1Dn = if showBands then RibbonFast - bATR * bandMult1 else Double.NaN;
plot Band2Up = if showBands then RibbonFast + bATR * bandMult2 else Double.NaN;
plot Band2Dn = if showBands then RibbonFast - bATR * bandMult2 else Double.NaN;
plot Band3Up = if showBands then RibbonFast + bATR * bandMult3 else Double.NaN;
plot Band3Dn = if showBands then RibbonFast - bATR * bandMult3 else Double.NaN;

Band1Up.SetDefaultColor(Color.light_gray);
Band1Dn.SetDefaultColor(Color.light_gray);
Band2Up.SetDefaultColor(Color.RED);
Band3Up.SetDefaultColor(Color.MAGENTA);
Band2Dn.SetDefaultColor(Color.GREEN);
Band3Dn.SetDefaultColor(Color.CYAN);

AddCloud(Band1Up, Band3Up, color.dark_red, color.dark_red);
AddCloud(Band1Dn, Band3Dn, color.dark_green, color.dark_green);
AddCloud(Band2Up, Band3Up, color.dark_red, color.dark_red);
AddCloud(Band2Dn, Band3Dn, color.dark_green, color.dark_green);

# END CODE


