
Author MEssage:
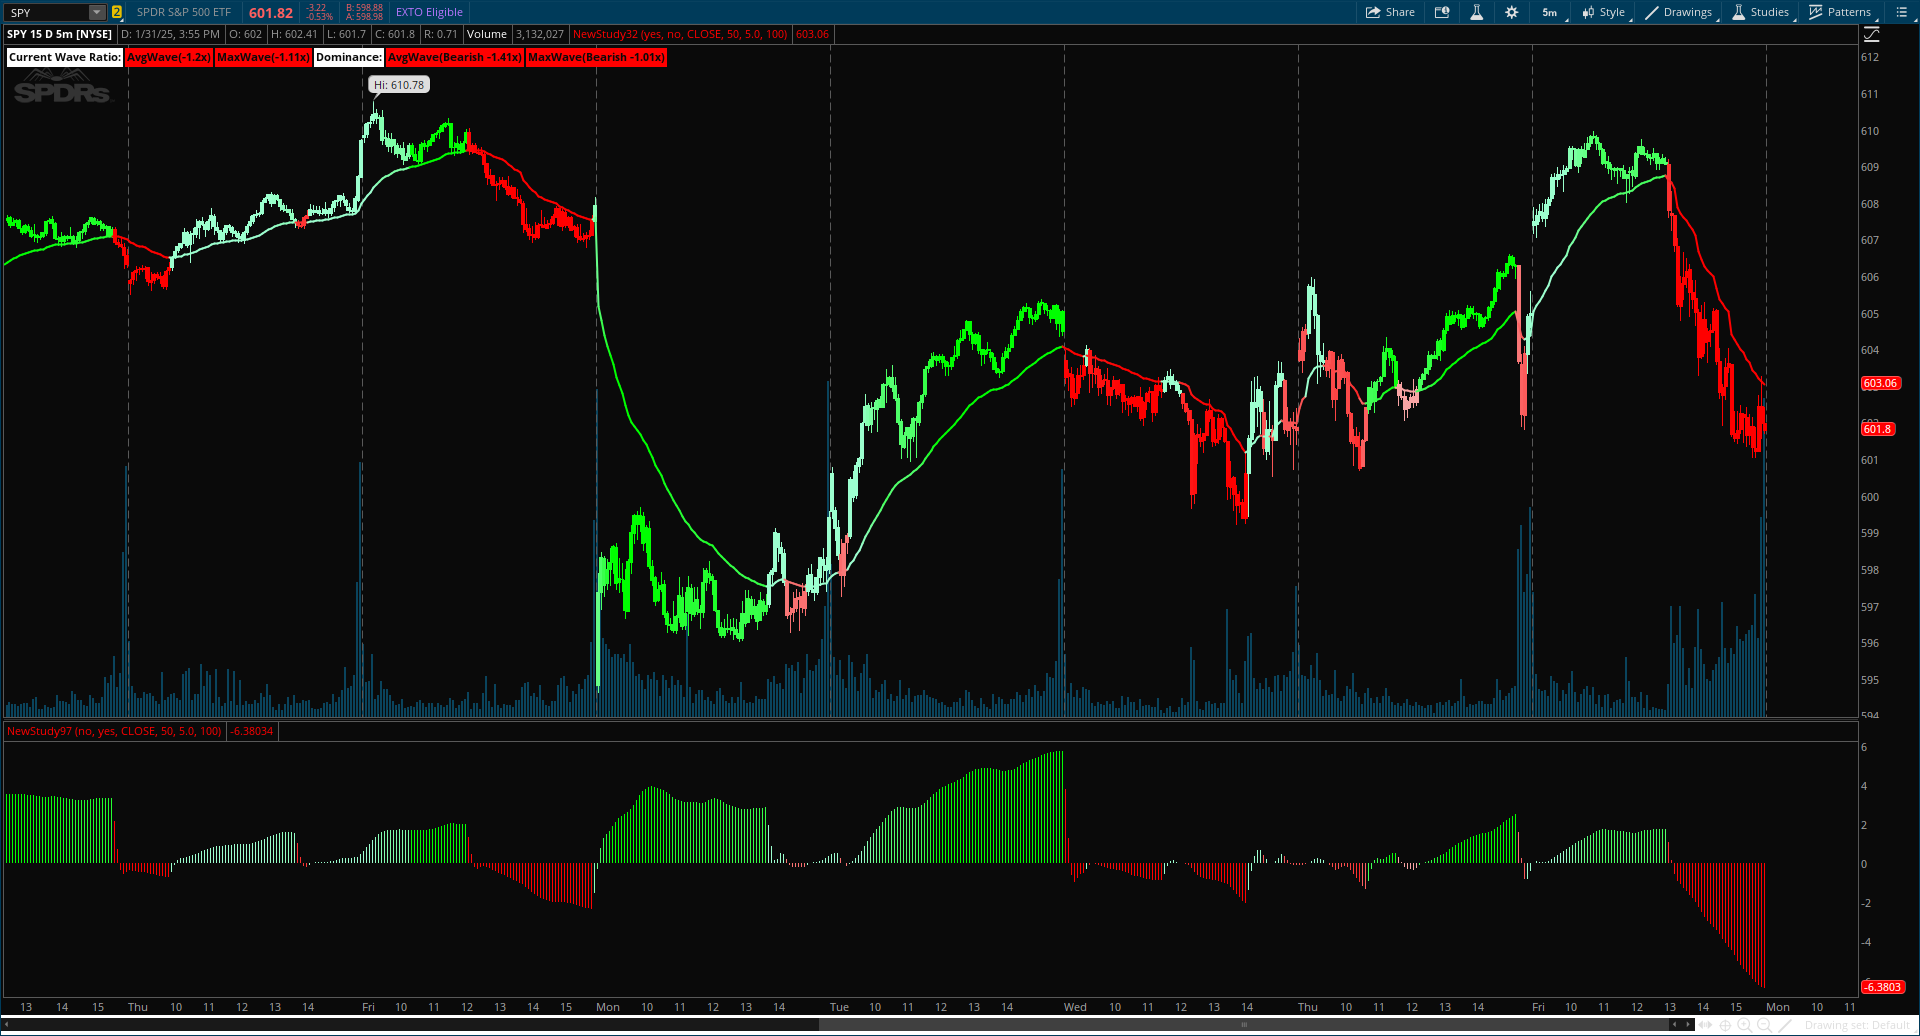
The Trend Speed Analyzer by Zeiierman is designed to measure the strength and speed of market trends, providing traders with actionable insights into momentum dynamics. By combining a dynamic moving average with wave and speed analysis, it visually highlights shifts in trend direction, market strength, and potential reversals. This tool is ideal for identifying breakout opportunities, gauging trend consistency, and understanding the dominance of bullish or bearish forces over various timeframes.
Upper Study:
CSS:
#// Indicator for TOS
#// © Zeiierman {
#Hint MaximumLength: This parameter sets the upper limit for the number of bars considered in the dynamic moving average. A higher value smooths out the trend line, making it less reactive to minor fluctuations but slower to adapt to sudden price movements. Use higher values for long-term trend analysis and lower values for faster-moving markets.
#Hint AcceleratorMultiplier: Adjusts the responsiveness of the dynamic moving average to price changes. A larger value makes the trend more reactive but can introduce noise in choppy markets. Lower values create a smoother trend but may lag behind rapid price movements. This is particularly useful in volatile markets where precise sensitivity is needed.
#Hint CollectionPeriod: Defines the number of bars used to normalize trend speed values. A higher value includes a broader historical range, smoothing out the speed calculation. Lower values make the speed analysis more sensitive to recent price changes, ideal for short-term trading.
#indicator('Trend Speed Analyzer (Zeiierman)', overlay = false)
# Converted by Sam4Cok@Samer800 - 02/2025
input EnableTable = yes; # 'Enable Table'
input colorBars = yes; # 'Enable Candles'
input source = close;
input MaximumLength = 50; # 'Maximum Length'
input AcceleratorMultiplier = 5.0; # 'Accelerator Multiplier'
input CollectionPeriod = 100; # 'Collection Period'
def na = Double.NaN;
def last = IsNaN(close);
#// ~~ Dynamic Average {
def max_abs_counts_diff = Highest(source, 200);
def counts_diff_norm = (source + max_abs_counts_diff) / (2 * max_abs_counts_diff);
def dyn_length = 5 + counts_diff_norm * (MaximumLength - 5);
##// ~~ Gradient Coloring {
Script gradient_color {
input src = close;
input minVal = 0;
input maxVal = 1;
input loR = 173;
input loG = 216;
input loB = 230;
input hiR = 41;
input hiG = 98;
input hiB = 255;
def value = if isNaN(src) then 0 else src;
def clamped_value = max(min(value, maxVal), minVal);
def normalized_value = (clamped_value - minVal) / (maxVal - minVal);
def re = floor(loR + (hiR - loR) * normalized_value);
def gr = floor(loG + (hiG - loG) * normalized_value);
def bl = floor(loB + (hiB - loB) * normalized_value);
plot r = re;
plot g = gr;
plot b = bl;
}
Script calc_accel_factor {
input counts_diff = close;
input prev_counts_diff = close;
def delta_counts_diff = AbsValue(counts_diff - prev_counts_diff);
def max_delta = highest(delta_counts_diff, 200);
def max_delta_counts_diff = if max_delta == 0 then 1 else max_delta;
def accel_factor = delta_counts_diff / max_delta_counts_diff;
plot out = accel_factor;
}
Script adjust_alpha {
input dyn_length = 1;
input accel_factor = 1;
input accel_multiplier = 5;
def alpha_base = 2 / (dyn_length + 1);
def alpha_ = alpha_base * (1 + accel_factor * accel_multiplier);
def alpha = min(1, alpha_); # // Ensure alpha does not exceed 1
plot out = alpha;
}
#// ~~ Accelerator Factor
def accel_factor = calc_accel_factor(source, source[1]);
def alpha = adjust_alpha(dyn_length, accel_factor, AcceleratorMultiplier);
#// ~~ Compute dynamic Ema
def dyn_ema = if isNaN(dyn_ema[1]) then close else if !dyn_ema[1] then close else alpha * close + (1 - alpha) * dyn_ema[1];
#// ~~ Trend Speed {
def trend = dyn_ema;
def c = WildersAverage(close, 10);
def o = WildersAverage(open, 10);
#// ~~ Trend direction {
def speed; def speed1; def xBear; def xBull;
def bullish; def bearish; def bearish_recent; def bullish_recent;
def maxx; def minn;
if (close > trend and close[1] <= trend) {
bearish = Min(if !bearish[1] then c - o else bearish[1], (if !minn[1] then c - o else minn[1]));
bearish_recent = bearish_recent[1] + (if !minn[1] then c - o else minn[1]);
bullish_recent = bullish_recent[1];
bullish = bullish[1];
xBear = xBear[1] + 1;
xBull = xBull[1];
speed1 = c - o;
minn = if !minn[1] then speed1 else minn[1];
maxx = Max(speed1, maxx[1]);
} else if (close < trend and close[1] >= trend) {
bullish = Max(bullish[1], (if !maxx[1] then c - o else maxx[1]));
bearish = if !bearish[1] then c - o else bearish[1];
bearish_recent = bearish_recent[1];
bullish_recent = bullish_recent[1] + (if !maxx[1] then c - o else maxx[1]);
xBear = xBear[1];
xBull = xBull[1] + 1;
speed1 = c - o;
minn = if !minn[1] then speed1 else Min(minn[1], speed1);
maxx = maxx[1];
} else {
bearish = if !bearish[1] then c - o else bearish[1];
bullish = if !bullish[1] then c - o else bullish[1];
bearish_recent = bearish_recent[1];
bullish_recent = bullish_recent[1];
xBear = xBear[1];
xBull = xBull[1];
speed1 = speed[1];
minn = if !minn[1] then speed1 else if close < trend then Min(minn[1], speed1) else minn[1];
maxx = if close > trend then Max(maxx[1], speed1) else maxx[1];
}
speed = speed1 + c - o;
#Color
def min_speed = lowest(speed, CollectionPeriod);
def max_speed = highest(speed, CollectionPeriod);
def normalized_speed = (speed - min_speed) / (max_speed - min_speed);
def rDn = gradient_color(normalized_speed, 0, 0.5, 255, 0, 0, 249, 164, 164).r;
def gDn = gradient_color(normalized_speed, 0, 0.5, 255, 0, 0, 249, 164, 164).g;
def bDn = gradient_color(normalized_speed, 0, 0.5, 255, 0, 0, 249, 164, 164).b;
def rUp = gradient_color(normalized_speed, 0.5, 1, 156, 255, 207, 0, 255, 0).r;
def gUp = gradient_color(normalized_speed, 0.5, 1, 156, 255, 207, 0, 255, 0).g;
def bUp = gradient_color(normalized_speed, 0.5, 1, 156, 255, 207, 0, 255, 0).b;
# -- plot
plot DynamicEMA = if !last then dyn_ema else na;
DynamicEMA.SetLineWeight(2);
DynamicEMA.AssignValueColor(if speed < 0 then CreateColor(rDn, gDn, bDn) else CreateColor(rUp, gUp, bUp));
#-- Bar Color
AssignPriceColor(if !colorBars then Color.CURRENT else
if speed < 0 then CreateColor(rDn, gDn, bDn) else CreateColor(rUp, gUp, bUp));
#// ~~ Table {
#// Calculate stats
def bull_max = highest(bullish, 200);
def bear_max = lowest(bearish, 200);
def bull_avg = bullish_recent / xBull;
def bear_avg = bearish_recent / xBear;
#// Calculate wave size ratios for max and average wave heights
def wave_size_ratio_avg = bull_avg / AbsValue(bear_avg);
def wave_Round_avg = Round(wave_size_ratio_avg, 2);
def wave_size_ratio_max = bull_max / AbsValue(bear_max);
def wave_Round_max = Round(wave_size_ratio_max, 2);
#// Current wave calculations
def current_wave = speed;
def current_ratio_avg = if current_wave > 0 then current_wave / bull_avg else current_wave / AbsValue(bear_avg);
def current_ratio_max = if current_wave > 0 then current_wave / bull_max else current_wave / AbsValue(bear_max);
def current_Round_avg = Round(current_ratio_avg, 2);
def current_Round_max = Round(current_ratio_max, 2);
#// Dominance calculation
def dominance_avg_value = bull_avg - AbsValue(bear_avg);
def dominance_max_value = bull_max - AbsValue(bear_max);
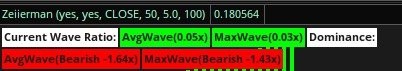
AddLabel(EnableTable, "Current Wave Ratio:", Color.WHITE);
AddLabel(EnableTable, "AvgWave(" + current_Round_avg + "x)", if current_ratio_avg > 0 then Color.GREEN else Color.RED);
AddLabel(EnableTable, "MaxWave(" + current_Round_max + "x)", if current_ratio_max > 0 then Color.GREEN else Color.RED);
AddLabel(EnableTable, "Dominance:", Color.WHITE);
AddLabel(EnableTable, "AvgWave(" + if dominance_avg_value > 0 then "Bullish +" + wave_Round_avg + "x" else
"Bearish -" + Round(1 / wave_size_ratio_avg, 2) + "x)", if dominance_avg_value>0 then Color.GREEN else Color.RED);
AddLabel(EnableTable, "MaxWave(" + if dominance_max_value > 0 then "Bullish +" + wave_Round_max + "x" else
"Bearish -" + Round(1 / wave_size_ratio_max, 2) + "x)", if dominance_max_value>0 then Color.GREEN else Color.RED);
#-- END of CODELower Study:
CSS:
#// Indicator for TOS
#// © Zeiierman
#Hint MaximumLength: This parameter sets the upper limit for the number of bars considered in the dynamic moving average. A higher value smooths out the trend line, making it less reactive to minor fluctuations but slower to adapt to sudden price movements. Use higher values for long-term trend analysis and lower values for faster-moving markets.
#Hint AcceleratorMultiplier: Adjusts the responsiveness of the dynamic moving average to price changes. A larger value makes the trend more reactive but can introduce noise in choppy markets. Lower values create a smoother trend but may lag behind rapid price movements. This is particularly useful in volatile markets where precise sensitivity is needed.
#Hint CollectionPeriod: Defines the number of bars used to normalize trend speed values. A higher value includes a broader historical range, smoothing out the speed calculation. Lower values make the speed analysis more sensitive to recent price changes, ideal for short-term trading.
#indicator('Trend Speed Analyzer (Zeiierman)', overlay = false)
# Converted by Sam4Cok@Samer800    - 02/2025

declare lower;

input EnableTable          = yes;  # 'Enable Table'
input colorBars = yes;             # 'Enable Candles'
input source = close;
input MaximumLength = 50;          # 'Maximum Length'
input AcceleratorMultiplier = 5.0; # 'Accelerator Multiplier'
input CollectionPeriod = 100;      # 'Collection Period'

def na = Double.NaN;
def last = IsNaN(close);

#// ~~  Dynamic Average {
def max_abs_counts_diff = Highest(source, 200);
def counts_diff_norm    = (source + max_abs_counts_diff) / (2 * max_abs_counts_diff);
def dyn_length          = 5 + counts_diff_norm * (MaximumLength - 5);

##// ~~ Gradient Coloring {
Script gradient_color {
input src = close;
input minVal = 0;
input maxVal = 1;
input loR = 173;
input loG = 216;
input loB = 230;
input hiR = 41;
input hiG = 98;
input hiB = 255;
    def value = if isNaN(src) then 0 else src;
    def clamped_value = max(min(value, maxVal), minVal);
    def normalized_value = (clamped_value - minVal) / (maxVal - minVal);
    def re = floor(loR + (hiR - loR) * normalized_value);
    def gr = floor(loG + (hiG - loG) * normalized_value);
    def bl = floor(loB + (hiB - loB) * normalized_value);
    plot r = re;
    plot g = gr;
    plot b = bl;
}

Script calc_accel_factor {
input counts_diff = close;
input prev_counts_diff = close;
    def delta_counts_diff = AbsValue(counts_diff - prev_counts_diff);
    def max_delta = highest(delta_counts_diff, 200);
    def max_delta_counts_diff = if max_delta == 0 then 1 else max_delta;
    def accel_factor = delta_counts_diff / max_delta_counts_diff;
    plot out = accel_factor;
}
Script adjust_alpha {
input dyn_length = 1;
input accel_factor = 1;
input accel_multiplier = 5;
    def alpha_base = 2 / (dyn_length + 1);
    def alpha_ = alpha_base * (1 + accel_factor * accel_multiplier);
    def alpha = min(1, alpha_); #  // Ensure alpha does not exceed 1
    plot out = alpha;
}
#// ~~ Accelerator Factor
def accel_factor = calc_accel_factor(source, source[1]);
def alpha        = adjust_alpha(dyn_length, accel_factor, AcceleratorMultiplier);
#// ~~ Compute dynamic Ema
def dyn_ema = if isNaN(dyn_ema[1]) then close else if !dyn_ema[1] then close else alpha * close + (1 - alpha) * dyn_ema[1];

#// ~~ Trend Speed {
def trend = dyn_ema;
def c = WildersAverage(close, 10);
def o = WildersAverage(open, 10);

#// ~~ Trend direction {
def speed; def speed1; def xBear; def xBull;
def bullish; def bearish; def bearish_recent; def bullish_recent;
def maxx; def minn;
if  (close > trend and close[1] <= trend) {
    bearish = Min(if !bearish[1] then c - o else bearish[1], (if !minn[1] then c - o else minn[1]));
    bearish_recent = bearish_recent[1] + (if !minn[1] then c - o else minn[1]);
    bullish_recent = bullish_recent[1];
    bullish = bullish[1];
    xBear   = xBear[1] + 1;
    xBull   = xBull[1];
    speed1 = c - o;
    minn = if !minn[1] then speed1 else minn[1];
    maxx = Max(speed1, maxx[1]);
} else if (close < trend and close[1] >= trend) {
    bullish = Max(bullish[1], (if !maxx[1] then c - o else maxx[1]));
    bearish = if !bearish[1] then c - o else bearish[1];
    bearish_recent = bearish_recent[1];
    bullish_recent = bullish_recent[1] + (if !maxx[1] then c - o else maxx[1]);
    xBear   = xBear[1];
    xBull   = xBull[1] + 1;
    speed1 = c - o;
    minn = if !minn[1] then speed1 else Min(minn[1], speed1);
    maxx = maxx[1];
} else {
    bearish = if !bearish[1] then c - o else bearish[1];
    bullish = if !bullish[1] then c - o else bullish[1];
    bearish_recent = bearish_recent[1];
    bullish_recent = bullish_recent[1];
    xBear = xBear[1];
    xBull = xBull[1];
    speed1 = speed[1];
    minn = if !minn[1] then speed1 else if close < trend then Min(minn[1], speed1) else minn[1];
    maxx = if close > trend then Max(maxx[1], speed1) else maxx[1];
}
speed = speed1 + c - o;
def trendspeed = HullMovingAvg(speed, 5);

#Color
def min_speed = lowest(speed, CollectionPeriod);
def max_speed = highest(speed, CollectionPeriod);
def normalized_speed = (speed - min_speed) / (max_speed - min_speed);
def rDn = gradient_color(normalized_speed, 0, 0.5, 255, 0, 0, 249, 164, 164).r;
def gDn = gradient_color(normalized_speed, 0, 0.5, 255, 0, 0, 249, 164, 164).g;
def bDn = gradient_color(normalized_speed, 0, 0.5, 255, 0, 0, 249, 164, 164).b;
def rUp = gradient_color(normalized_speed, 0.5, 1, 156, 255, 207, 0, 255, 0).r;
def gUp = gradient_color(normalized_speed, 0.5, 1, 156, 255, 207, 0, 255, 0).g;
def bUp = gradient_color(normalized_speed, 0.5, 1, 156, 255, 207, 0, 255, 0).b;


# -- plot

plot DynamicEMA = if !last then trendspeed else na;
DynamicEMA.SetLineWeight(3);
DynamicEMA.SetPaintingStrategy(PaintingStrategy.HISTOGRAM);
DynamicEMA.AssignValueColor(if speed < 0 then CreateColor(rDn, gDn, bDn) else CreateColor(rUp, gUp, bUp));
AssignPriceColor(if !colorBars then Color.CURRENT else
                 if speed < 0 then CreateColor(rDn, gDn, bDn) else CreateColor(rUp, gUp, bUp));

#// ~~ Table {
#// Calculate stats
def bull_max = highest(bullish, 200);
def bear_max = lowest(bearish, 200);
def bull_avg = bullish_recent / xBull;
def bear_avg = bearish_recent / xBear;
#// Calculate wave size ratios for max and average wave heights
def wave_size_ratio_avg = bull_avg / AbsValue(bear_avg);
def wave_Round_avg = Round(wave_size_ratio_avg, 2);
def wave_size_ratio_max = bull_max / AbsValue(bear_max);
def wave_Round_max = Round(wave_size_ratio_max, 2);
#// Current wave calculations
def current_wave       = speed;
def current_ratio_avg = if current_wave > 0 then current_wave / bull_avg else current_wave / AbsValue(bear_avg);
def current_ratio_max = if current_wave > 0 then current_wave / bull_max else current_wave / AbsValue(bear_max);
def current_Round_avg = Round(current_ratio_avg, 2);
def current_Round_max = Round(current_ratio_max, 2);
#// Dominance calculation
def dominance_avg_value = bull_avg - AbsValue(bear_avg);
def dominance_max_value = bull_max - AbsValue(bear_max);

AddLabel(EnableTable, "Current Wave Ratio:", Color.WHITE);
AddLabel(EnableTable, "AvgWave(" + current_Round_avg + "x)", if current_ratio_avg > 0 then Color.GREEN else Color.RED);
AddLabel(EnableTable, "MaxWave(" + current_Round_max + "x)", if current_ratio_max > 0 then Color.GREEN else Color.RED);
AddLabel(EnableTable, "Dominance:", Color.WHITE);
AddLabel(EnableTable, "AvgWave(" + if dominance_avg_value > 0 then "Bullish +" + wave_Round_avg + "x" else
         "Bearish -" + Round(1 / wave_size_ratio_avg, 2) + "x)", if dominance_avg_value>0 then Color.GREEN else Color.RED);
AddLabel(EnableTable, "MaxWave(" + if dominance_max_value > 0 then "Bullish +" + wave_Round_max + "x" else
         "Bearish -" + Round(1 / wave_size_ratio_max, 2) + "x)", if dominance_max_value>0 then Color.GREEN else Color.RED);


#-- END of CODE

")
 Average Wave and Max Wave
 If It was a dog, I’d be dead. I'll try to convert it