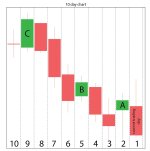
Greetings! I'm after a trend scan that works on a 10 day chart using 3 data points, where the close of A is less than the close of B and the close of B is less than the close of C. Please see the illustration below. I know this would be an easy script for the more experienced and I would sure appreciate the help. I checked the forums and couldn't find anything that addresses this specifically. I also tried a solution using the candlestick pattern editor but not sure how to space the candles for the days needed.
What I think could be valuable about this scan is that it allows for plenty of price action volatility between data points A,B,C while still keeping a general direction intact. Thanks! =A=
14456[/ATTACH]']

What I think could be valuable about this scan is that it allows for plenty of price action volatility between data points A,B,C while still keeping a general direction intact. Thanks! =A=
14456[/ATTACH]']
Attachments
Last edited by a moderator:

