
Author Message:
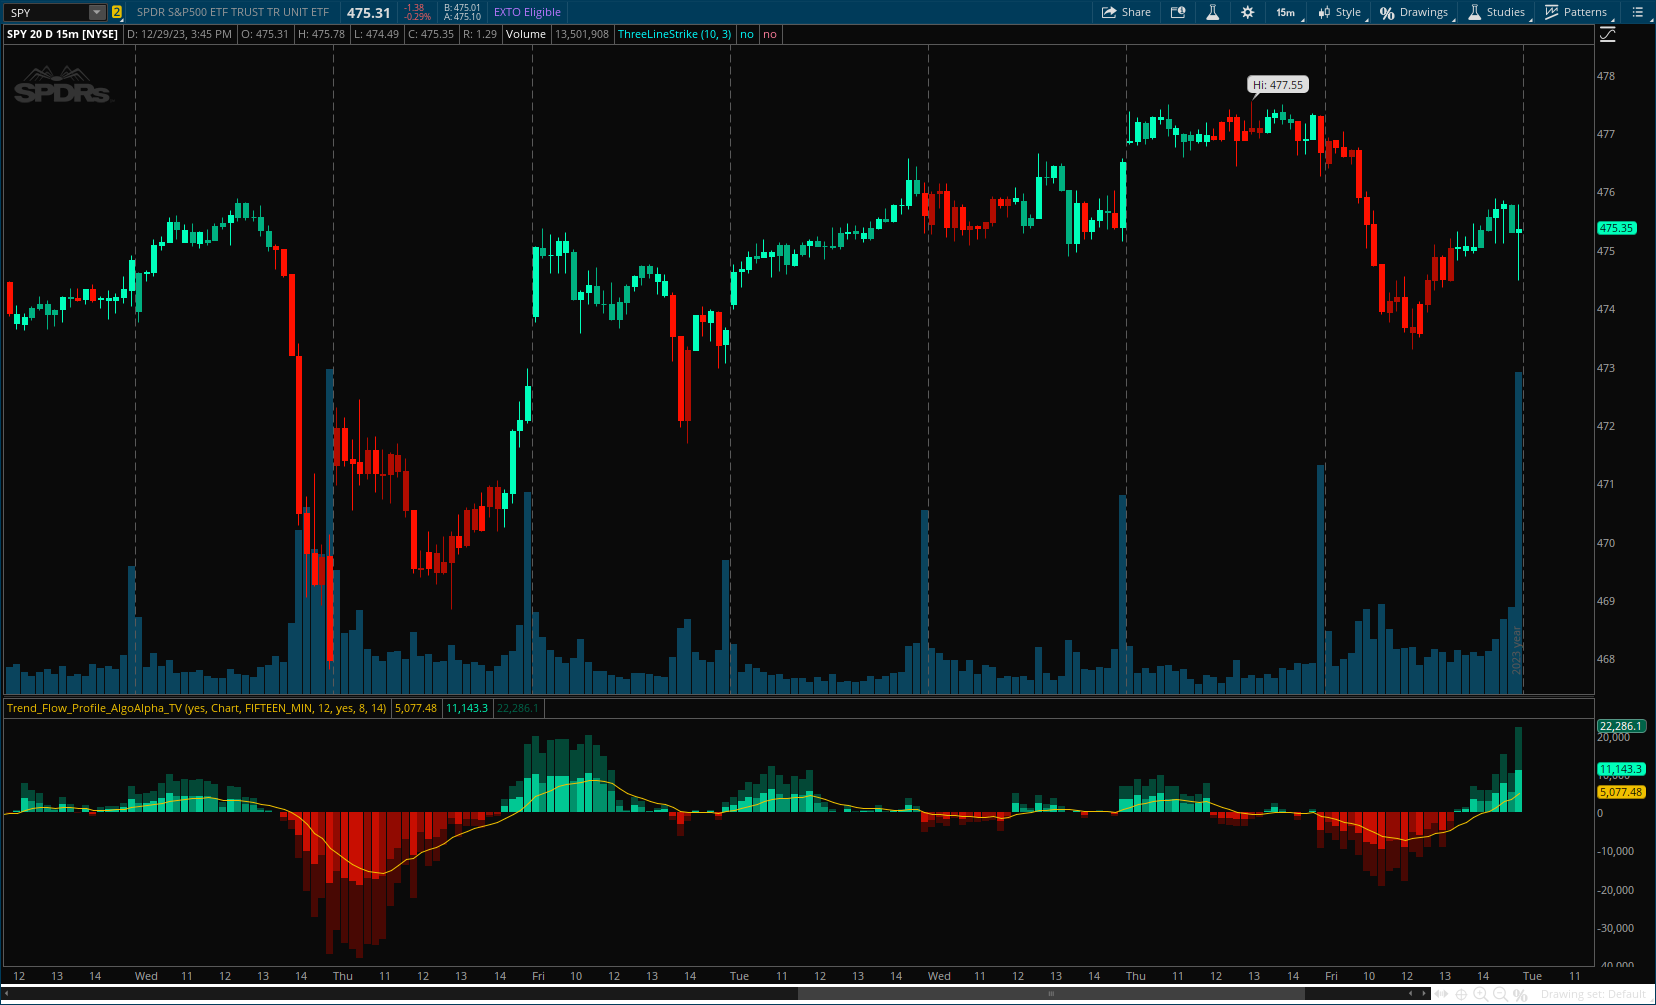
The "Trend Flow Profile" indicator is a powerful tool designed to analyze and interpret the underlying trends and reversals in a financial market. It combines the concepts of Order Flow and Rate of Change (ROC) to provide valuable insights into market dynamics, momentum, and potential trade opportunities. By integrating these two components, the indicator offers a comprehensive view of market sentiment and price movements, facilitating informed trading decisions.
CODE:
CSS:
#// https://www.tradingview.com/v/ui5VLe7A/
#// This source code is subject to the terms of the Mozilla Public License 2.0 at https://mozilla.org/MPL/2.0/
#// © AlgoAlpha X © Sushiboi77
#indicator('Trend Flow Profile [AlgoAlpha]', 'AlgoAlpha - ? Trend Flow Profile '
# Converted by Sam4Cok@Samer800    - 01/2024
declare lower;
#// Inputs
input colorBars = yes;
input timeframe = {Default "Chart", "Custom"};
input customTimeframe = AggregationPeriod.FIFTEEN_MIN;
input trendFlowPeriod = 12;         # 'Trend Flow Period'
input showEmaLine = yes;            # "Show EMA band?"
input emaLength = 8;                # "EMA Length"
input rocLength = 14;               # "ROC Length"

def na = Double.NaN;
def chart = timeframe==timeframe."Chart";
DefineGlobalColor("ln"  , CreateColor(240, 192, 0));
DefineGlobalColor("up2" , CreateColor(0,255,187));
DefineGlobalColor("up1" , CreateColor(0,177,129));
DefineGlobalColor("up3" , CreateColor(0,98,72));
DefineGlobalColor("dn2" , CreateColor(255,17,0));
DefineGlobalColor("dn1" , CreateColor(177,12,0));
DefineGlobalColor("dn3" , CreateColor(98,7,0));

def cHT = close(Period = customTimeframe);
def vHT = volume(Period = customTimeframe);
def c = if chart then close else cHT;
def v = if chart then volume else vHT;
#// Calculations
def trend = if c > c[1] then  v else
            if c < c[1] then -v else 0;
def volFlow = Sum(trend, trendFlowPeriod) / 1000;
def priceROC = RateOfChange(Price = c,Length = rocLength);
def tfIndicator = (priceROC + volFlow) / 2;
def emaTrend = ExpAverage(tfIndicator, emaLength);

#// Color Logic
def Col = if tfIndicator > 0 then
          if tfIndicator > tfIndicator[1] then  2 else  1 else
          if tfIndicator < tfIndicator[1] then -2 else -1;
def volVol = volFlow > 0;

#// Plots
plot avgTrend = if showEmaLine then emaTrend else na;    # 'EMA Trend Line'
plot TrendFlow = tfIndicator;    # 'Trend Flow'
plot VolumeFlow = volFlow;       # 'Volume Flow'
avgTrend.SetDefaultColor(GlobalColor("ln"));
TrendFlow.SetPaintingStrategy(PaintingStrategy.SQUARED_HISTOGRAM);
TrendFlow.AssignValueColor(if Col== 2 then GlobalColor("up2") else
                           if Col== 1 then GlobalColor("up1") else
                           if Col==-2 then GlobalColor("dn2") else
                           if Col==-1 then GlobalColor("dn1") else Color.GRAY);
VolumeFlow.SetPaintingStrategy(PaintingStrategy.SQUARED_HISTOGRAM);
VolumeFlow.AssignValueColor(if volVol then GlobalColor("up3") else GlobalColor("dn3"));

AssignPriceColor(if !colorBars then Color.CURRENT else
                 if Col== 2 then GlobalColor("up2") else
                 if Col== 1 then GlobalColor("up1") else
                 if Col==-2 then GlobalColor("dn2") else
                 if Col==-1 then GlobalColor("dn1") else Color.GRAY);

#-- END of CODE