text progress bar , 0 to 100
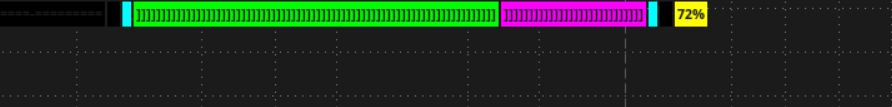
this displays a quantity of characters, in a label, 0 to 100, from a number.
i picked 0 to 100, with the intention of it displaying a number range as a percentage.
it uses combinations of 3 groups of characters , 1, 5, 25, to create the desired total.
i chose these because a small quantity of conditions are needed to display up to 100 chars.
.. 5 x 1s , 4 x 5s , 4 x 25s
there are labels that show the input number and the quantity of each group needed.
it will show the quantities for larger numbers, but only accurately display up to 124 chars.
Ruby:
# horz_progress_bar_01

# halcyonguy
# 22-04-04
# build a horizontal progress bar, 1 to 100
# from text chars
#  div  1, 5, 25

# this is actually narrower than the vertical line
input c1 = "]";
input c5 = "]]]]]";
input c25 = "]]]]]]]]]]]]]]]]]]]]]]]]]";

#input c1 = "|";
#input c5 = "|||||";
#input c25 = "|||||||||||||||||||||||||";

input test_num = 38;
def t = test_num;

script divqty {
input num = 0;
input div = 0;
plot quot = floor(num/div);
plot remain = num % div;
}

def div1 = 1;
def div5 = 5;
def div25 = 25;

# divide by biggest
def q25 = divqty(t, div25).quot;
def r25 = divqty(t, div25).remain;
# divide by smaller
def q5 = divqty(r25, div5).quot;
def r5 = divqty(r25, div5).remain;
# divide by smallest
def q1 = divqty(r5, div1).quot;
def r1 = divqty(r5, div1).remain;

addlabel(1 , "    " , color.black);
addlabel(1 , t , color.yellow);
addlabel(1 , "  " , color.black);
addlabel(1 , q25 + " * " + div25 + " = " + (q25 * div25), color.yellow);
addlabel(1 , q5 + " * " + div5 + " = " + (q5 * div5), color.yellow);
addlabel(1 , q1 + " * " + div1 + " = " + (q1 * div1), color.yellow);
addlabel(1 , "  " , color.black);

addlabel(1,
(if q25 == 1 then c25 else if q25 == 2 then c25 + c25 else if q25 == 3 then c25 + c25 + c25 else if q25 == 4  then c25 + c25 + c25 + c25 else "") +
(if q5 == 1 then c5 else if q5 == 2 then c5 + c5 else if q5 == 3 then c5 + c5 + c5 else if q5 == 4  then c5 + c5 + c5 + c5 else "") +
(if q1 == 1 then c1 else if q1 == 2 then c1 + c1 else if q1 == 3 then c1 + c1 + c1 else if q1 == 4  then c1 + c1 + c1 + c1 else "")
, color.yellow);
#