Technical Method For Rating Stocks For ThinkOrSwim

mc01439

Well-known member
2019 Donor
VIP
I have been using this rating system as part of a longer term trading strategy on WealthLab.

Would like to use on TOS as well but TDAmeritrade did not summit the code for this Technical Analysis of Stocks & Commodities June 2018 article. Anyone like to take a shot at the code.
 
Last edited by a moderator:
Technical Stock Rating Labels

This TOS indicator provides labels that are colored blue and only appear when bullish conditions exist
(the blue labels on chart are the default)

GepxtdL.png


With this modified version of the indicator, the labels are: green colored for Bullish and Red for Bear.

Also added an additional label "score" which is defined in the TOS Technical Stock Rating Strategy.

Ruby:
# TOS TechnicalStockRating

input vfiLength = 130;
input averageLength = 100;
input trendQualityLength = 63;
input maxStiffness = 7;
input marketIndex = "SPY";
input weightForMoneyFlow = 1.0;
input weightForTradingAboveAverage = 1.0;
input weightForUptrend = 1.0;
input weightForTrendQuality = 1.0;
input weightForMarketDirection = 2.0;

def vfi = reference VolumeFlowIndicator(length = vfiLength, "max volume cut off" = 2.5);
def sma = Average(close, averageLength);
def ema = ExpAverage(close(marketIndex), averageLength);
def stiffness = Sum(close < sma, trendQualityLength);

plot Score;
score.hide();
def MoneyFlow = vfi > 0;
def TradingAboveAverage = close > sma;
def Uptrend = sma > sma[4];
def TrendQuality = stiffness <= maxStiffness;
def MarketDirection = ema >= ema[2];

Score = (!isnan(weightForMoneyFlow) * !isnan(MoneyFlow)) + (!isnan(weightForTradingAboveAverage) * !isnan(TradingAboveAverage)) + (!isnan(weightForUptrend * Uptrend)) + (!isnan(weightForTrendQuality * TrendQuality)) + (!isnan(weightForMarketDirection) * !isnan(MarketDirection));

DefineGlobalColor("Pre_Cyan", CreateColor(50, 200, 255)) ;
DefineGlobalColor("LabelGreen",  CreateColor(0, 165, 0)) ;
DefineGlobalColor("LabelRed",  CreateColor(225, 0, 0)) ;
AddLabel(yes, "Score=" +score,
         if Score> 5 then GlobalColor("Pre_Cyan") else
         if Score==5 then GlobalColor("LabelGreen") else GlobalColor("LabelRed"));
AddLabel(!isnan(MoneyFlow), "Money flow",
         if MoneyFlow then GlobalColor("LabelGreen") else GlobalColor("LabelRed"));
AddLabel(!isnan(TradingAboveAverage), "Trading above average",
         if TradingAboveAverage then GlobalColor("LabelGreen") else GlobalColor("LabelRed") );
AddLabel(!isnan(Uptrend), "Uptrend",
         if Uptrend then GlobalColor("LabelGreen") else GlobalColor("LabelRed"));
AddLabel(!isnan(TrendQuality), "Trend quality",
         if TrendQuality then GlobalColor("LabelGreen") else GlobalColor("LabelRed"));
AddLabel(!isnan(MarketDirection), "Market direction",
         if MarketDirection then GlobalColor("LabelGreen") else GlobalColor("LabelRed"));
 
Last edited:
@MerryDay You're awesome... works like a charm... now if I can only get the daily trend range problem fixed, I'll be golden. THANKS !! Wow... all my stocks are 5's and 6's... ugh... That's strong sell, right?
 
Last edited:
@Ronathan Edwards
Why would you sell? 5's and 6's are an almost perfect score.

As per the TOS Technical Stock Rating Strategy:
"The stock symbol receives one point for meeting each of the above criteria if all the weights are set to 1.0. By default, only the "overall market direction" weight is equal to 2.0; however, you are free to assign the weights according to your preferences.
By default, the strategy adds a simulated buy to open order if the currently selected stock receives a rating score of 5.0 or higher"


A 6 is a perfect rating. A 5 is a strong indicator
 
Last edited:
Technical Stock Rating Labels

This TOS indicator provides labels that are colored blue and only appear when bullish conditions exist
(the blue labels on chart are the default)

GepxtdL.png


With this modified version of the indicator, the labels always appear: green colored for Bullish and Red for Bear.

Also added an additional label "score" which is defined in the TOS Technical Stock Rating Strategy.

Here is the study link: http://tos.mx/N2Wufe3
Can the Score be scanned, please?

How about searching for all items with Score greater than 3?
 
Can the Score be scanned, please?

How about searching for all items with Score greater than 3?
Add this to the bottom of the script:
Ruby:
plot scan = score > 3 ;
In the scan hacker:
Ruby:
scan is true
 
Too many outcomes are NaN. What can I do about that?

Can we just have the total script with these changes wo allow filtering without the NaN outcomes? thx
 
Last edited by a moderator:
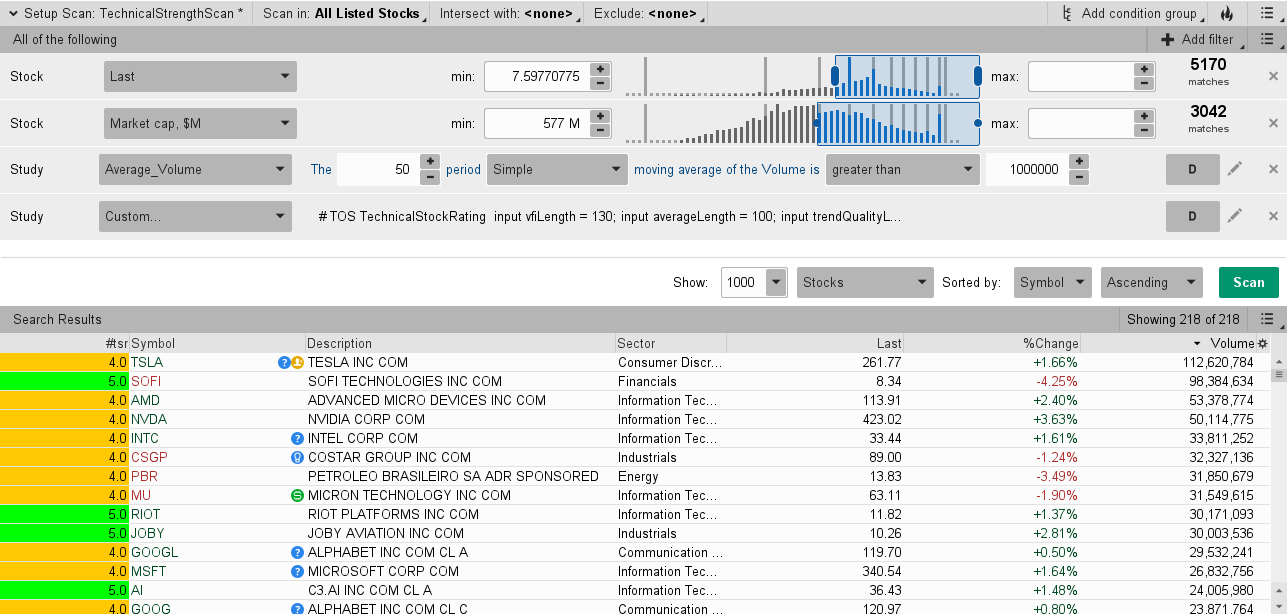
Technical Stock Rating Scan

This scan finds stocks with a strength greater than 3.
Edit the last line of the script if you want to find a different score.

Shared Scan Link: http://tos.mx/fqeWhA5 Click here for --> Easiest way to load shared links
LWQbhmo.png

Ruby:
# TOS TechnicalStockRating

input vfiLength = 130;
input averageLength = 100;
input trendQualityLength = 63;
input maxStiffness = 7;
input marketIndex = "SPY";
input weightForMoneyFlow = 1.0;
input weightForTradingAboveAverage = 1.0;
input weightForUptrend = 1.0;
input weightForTrendQuality = 1.0;
input weightForMarketDirection = 2.0;

def vfi = reference VolumeFlowIndicator(length = vfiLength, "max volume cut off" = 2.5);
def sma = Average(close, averageLength);
def ema = ExpAverage(close(marketIndex), averageLength);
def stiffness = Sum(close < sma, trendQualityLength);

def Score;

def MoneyFlow = vfi > 0;
def TradingAboveAverage = close > sma;
def Uptrend = sma > sma[4];
def TrendQuality = stiffness <= maxStiffness;
def MarketDirection = ema >= ema[2];

Score = (!isnan(weightForMoneyFlow) * !isnan(MoneyFlow)) + (!isnan(weightForTradingAboveAverage) * !isnan(TradingAboveAverage)) + (!isnan(weightForUptrend * Uptrend)) + (!isnan(weightForTrendQuality * TrendQuality)) + (!isnan(weightForMarketDirection) * !isnan(MarketDirection));

plot scan = score > 3 ;
@Mondomomo
 
Last edited:
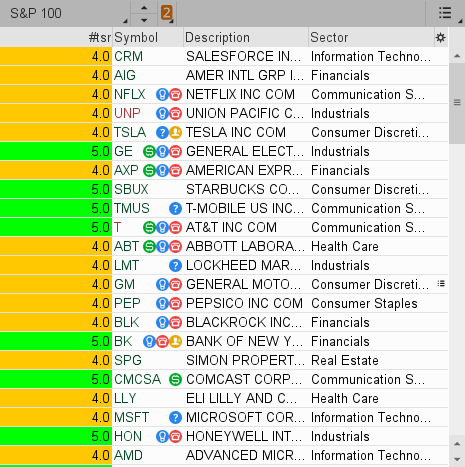
Technical Stock Rating Watchlist
Shared Watchlist Script: http://tos.mx/VK7YRWp Click here for --> Easiest way to load shared links
TvFHFe9.png

Ruby:
# TOS TechnicalStockRating

input vfiLength = 130;
input averageLength = 100;
input trendQualityLength = 63;
input maxStiffness = 7;
input marketIndex = "SPY";
input weightForMoneyFlow = 1.0;
input weightForTradingAboveAverage = 1.0;
input weightForUptrend = 1.0;
input weightForTrendQuality = 1.0;
input weightForMarketDirection = 2.0;

def vfi = reference VolumeFlowIndicator(length = vfiLength, "max volume cut off" = 2.5);
def sma = Average(close, averageLength);
def ema = ExpAverage(close(marketIndex), averageLength);
def stiffness = Sum(close < sma, trendQualityLength);

plot Score;
def MoneyFlow = vfi > 0;
def TradingAboveAverage = close > sma;
def Uptrend = sma > sma[4];
def TrendQuality = stiffness <= maxStiffness;
def MarketDirection = ema >= ema[2];

Score = (!isnan(weightForMoneyFlow) * !isnan(MoneyFlow)) + (!isnan(weightForTradingAboveAverage) * !isnan(TradingAboveAverage)) + (!isnan(weightForUptrend * Uptrend)) + (!isnan(weightForTrendQuality * TrendQuality)) + (!isnan(weightForMarketDirection) * !isnan(MarketDirection));

AssignBackgroundColor(
         if Score> 5 then color.cyan else
         if Score==5 then color.green else
         if Score==4 then color.orange else  color.red);
 
@MerryDay Thanks for a very unique indicator. I am having a bit of trouble with the watchlist column. It seems to color every bar Green with a 5 score. Initially, it will have some different scores, but as the scan completes they all change to green(5). I am using the Shared Scan Link for the custom study in the scan and the Share Watchlist Script for the watchlist column formula. On the chart, the modified labels show correctly with the score.
 

Join useThinkScript to post your question to a community of 21,000+ developers and traders.

Not the exact question you're looking for?

Start a new thread and receive assistance from our community.

87k+ Posts
295 Online
Create Post

The Market Trading Game Changer

Join 2,500+ subscribers inside the useThinkScript VIP Membership Club
  • Exclusive indicators
  • Proven strategies & setups
  • Private Discord community
  • ‘Buy The Dip’ signal alerts
  • Exclusive members-only content
  • Add-ons and resources
  • 1 full year of unlimited support

Frequently Asked Questions

What is useThinkScript?

useThinkScript is the #1 community of stock market investors using indicators and other tools to power their trading strategies. Traders of all skill levels use our forums to learn about scripting and indicators, help each other, and discover new ways to gain an edge in the markets.

How do I get started?

We get it. Our forum can be intimidating, if not overwhelming. With thousands of topics, tens of thousands of posts, our community has created an incredibly deep knowledge base for stock traders. No one can ever exhaust every resource provided on our site.

If you are new, or just looking for guidance, here are some helpful links to get you started.

What are the benefits of VIP Membership?
VIP members get exclusive access to these proven and tested premium indicators: Buy the Dip, Advanced Market Moves 2.0, Take Profit, and Volatility Trading Range. In addition, VIP members get access to over 50 VIP-only custom indicators, add-ons, and strategies, private VIP-only forums, private Discord channel to discuss trades and strategies in real-time, customer support, trade alerts, and much more. Learn all about VIP membership here.
How can I access the premium indicators?
To access the premium indicators, which are plug and play ready, sign up for VIP membership here.
Back
Top