dsvitale
New member
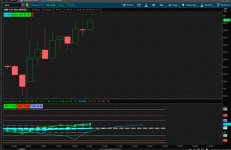
I have merged the SVSI and the TDI to plot together. How can I get the SVSI to plot a certain number of candles forward or backward?
Ruby:
# LS_TradersDynamIcIndex_long
# Traders Dynamic Index
# 2 smoothed RSIs Plotted on OverBought / OverSold Grid
# with Bollinger Band of unsmoothed RSIs

declare lower;
input averageType = {default SMA, EMA, wildersAverage};
input over_bought = 68;
input over_sold = 32;

# RSI (Relative Strength Index)====================

input Period = 13;
def RegRSI = reference RSI(Period);

# Compute 2 smoothed (by averaging) RSIs------------------
# 2 Smoothers--------------------------------------------------------
input sm1 = 2; # 1st RSI smoother
input sm2 = 7; # 2nd RSI smoother

# 1st smoothed RSI--------------------------------------------------
# Either ----------------------------------------------------------------
# (1) a simple averaging (SMA) or -------------------------
# (2) an exponential averaging (EMA)---------------------

def smRSI1 = if averageType == averageType.SMA then Average(RegRSI, sm1 ) else ExpAverage(RegRSI, sm1);

# 2nd smoothed RSI------------------------------------------------
# Either ---------------------------------------------------------------
# (1) a simple averaging (SMA) or ---------------------
# (2) an exponential averaging (EMA)-----------------

def smRSI2 = if averageType == averageType.SMA then Average(RegRSI, sm2) else ExpAverage(RegRSI, sm2);

# So far we have:
# 1. RegRSI = RSI
# 2. smRSI1 = 1st smoothed RSI, smoother = 2
# 3. smRSI2 = 2nd smoothed RSI, smoother = 7

#--------------------------------------------------------------------------
# PLOTS---------------------------------------------------------------
#---------------------------------------------------------------------------


# RSI1---1st smoothed RSI----------------------------------------
plot RSI1 = smRSI1;
RSI1.SetDefaultColor(Color.GREEN);
RSI1.SetLineWeight(2);
RSI1.SetStyle(Curve.FIRM);
RSI1.SetPaintingStrategy(PaintingStrategy.LINE_VS_POINTS);
RSI1.HideBubble();
RSI1.HideTitle();

# RSI2---2nd smoothed RSI---------------------------------------
plot RSI2 = smRSI2;
RSI2.SetDefaultColor(Color.CYAN);
RSI2.SetLineWeight(2);
RSI2.SetStyle(Curve.FIRM);
RSI2.SetPaintingStrategy(PaintingStrategy.LINE_VS_POINTS);
RSI2.HideBubble();
RSI2.HideTitle();

#============================================
# Bollinger Bands of RSI=========================
#============================================

# Length of Bollinger Averaging---------------------------------
input BBlength = 34;
# Width of Bollinger Band in Standard Deviations----------
input BBsdMult = 1.5;
# Mid-line for the Bollinger Band of the RegRSIs -----------

plot BBmidline = Average(RegRSI, BBlength);
BBmidline.SetDefaultColor(Color.CYAN);
BBmidline.SetLineWeight(5);
BBmidline.SetPaintingStrategy(PaintingStrategy.LINE_VS_POINTS);
BBmidline.SetStyle(Curve.FIRM);
BBmidline.HideBubble();
BBmidline.HideTitle();

#BBmidline.AssignValueColor(if BBmidline < BBmidline [1] then Color.red else (if BBmidline == BBmidline [1] then Color.green else Color.white));

#--------------------------------------------------------------------------
# Upper and Lower Bollinger Bands---------------------------
#---------------------------------------------------------------------------

# Standard Deviation of unsmoothed RSIs-------------------
def SDBB = StDev(RegRSI, BBlength);

# Upper Line of Bollinger Band----------------------------------
plot uBBline = BBmidline + BBsdMult * SDBB;

uBBline.SetDefaultColor(Color.WHITE);
uBBline.SetStyle(Curve.LONG_DASH);
uBBline.SetLineWeight(1);
uBBline.HideBubble();
uBBline.HideTitle();

# Lower Line of Bollinger Band---------------------------------
plot lBBline = BBmidline - BBsdMult * SDBB;

lBBline.SetDefaultColor(Color.WHITE);
lBBline.SetStyle(Curve.LONG_DASH);
lBBline.SetLineWeight(1);
lBBline.HideBubble();
lBBline.HideTitle();

#--------------------------------------------------------------------------
# GRID-----------------------------------------------------------------
#--------------------------------------------------------------------------

plot OB = 68; # OverBought
plot ML = 50; # Mid-Line
plot OS = 32; # OverSold

OB.SetStyle(Curve.FIRM);
OB.SetDefaultColor(Color.VIOLET);
OB.SetLineWeight(1);
#OB.HideBubble();
OB.HideTitle();

ML.SetStyle(Curve.LONG_DASH);
ML.SetDefaultColor(Color.WHITE);
ML.SetLineWeight(3);
#ML.HideBubble();
ML.HideTitle();


OS.SetStyle(Curve.FIRM);
OS.SetDefaultColor(Color.LIGHT_GREEN);
OS.SetLineWeight(1);
#OS.HideBubble();
OS.HideTitle();

#---------------------------------------------------------------------------
# Cloud between RSI2 and BBmidline-------------------------
#---------------------------------------------------------------------------

#AddCloud (RSI2, BBmidline, Color.WHITE, Color.YELLOW);

#plot OverSold = over_sold;
#plot OverBought = over_bought;


AddLabel (yes, " RSI1 " + Round (RSI1 , 2) , Color.GREEN);

AddLabel (yes, " RSI2 " + Round (RSI2 , 2) , Color.light_RED);

input emaLength = 6;
input vsiLength = 14;
input over_b = 80;
input over_s = 20;
input Extreme_High = 95;
input Extreme_Low = 15;


def ema = ExpAverage(close, emaLength);
def avgVolUp = WildersAverage(if close > ema then volume else 0, vsiLength);
def avgVolDown = WildersAverage(if close < ema then volume else 0, vsiLength);

plot SlowVSI = if avgVolUp + avgVolDown == 0 then 50 else 100 * avgVolUp / (avgVolUp + avgVolDown);
plot OverBought = over_b;
plot MiddleLine = 50;
plot OverSold = over_s;
plot EH = Extreme_High;
plot EL = Extreme_Low;

SlowVSI.SetDefaultColor(GetColor(1));
OverBought.SetDefaultColor(GetColor(5));
MiddleLine.SetDefaultColor(GetColor(5));
MiddleLine.SetStyle(Curve.LONG_DASH);
OverSold.SetDefaultColor(GetColor(5));

AddLabel (yes, " SVSI " + Round (SLowVSI , 2) , Color.viOLET);

# END ======================================
Last edited by a moderator: