• Get $40 off VIP by signing up for a free account! Sign Up

"SuperComboBullBear" and Linus's Supertrend For ThinkOrSwim

Shinthus

Active member
2019 Donor
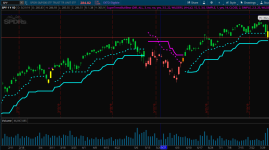
Linus has a few really nice supertrend scripts in the ThinkScript_Cloud. Here are 2 I found useful:

Code:
## START STUDY
## SuperCombo Bull/Bear Indicator
## linus, 2014-07-24, v0.1

#hint: SuperTrend of price, RSI and Ultimate Oscillator, combined with Chandelier stops.

## Signal inputs:
input paintBars = {OFF, default DIR, STR};
input signals = {OFF, default ALL, ST, CS, RSI, UO};
input strength = {"1", "2", default "3", "4"};
input showLabel = Yes;
input showBubbles = Yes;
input showPrompt = Yes;

## SuperTrend of Price inputs:
input stATRMult = 3.5;
input stATRLength = 22;
input stATRType = AverageType.WILDERS;
input stPivot = hl2;

## Chandelier Stop inputs:
input csPeriod = 15;
input csATRLength = 5;
input csATRMult = 3.0;   
input csATRType = AverageType.SIMPLE;
input csShift = 1; 
input csHideOpposite = Yes; 

## SuperTrend of RSI inputs:
input rsiLength = 14;
input rsiPrice = close;
input rsiSmooth = 2;
input rsiSmoothType = AverageType.SIMPLE;
input rsiATRMult = 2.3;
input rsiATRLength = 25;
input rsiATRType = AverageType.WILDERS;

## SuperTrend of Ultimate Oscillator inputs:
input uoFastLen = 7;
input uoMedLen = 14;
input uoSlowLen = 28;
input uoATRMult = 2.8;
input uoATRLength = 3;
input uoATRType = AverageType.SIMPLE;

########################################
## SuperTrend of Price

def stATR = MovingAverage(stATRType, TrueRange(high, close, low), stATRLength) * stATRMult;

def stUp = stPivot + stATR;
def stDn = stPivot - stATR;

def rStTrend = compoundValue(1,
    if rStTrend[1] > 0 then
        if close < Max(stDn[1], rStTrend[1]) then -stUp
        else Max(stDn, rStTrend[1])
    else if rStTrend[1] < 0 then
        if close > Min(stUp[1], AbsValue(rStTrend[1])) then stDn
        else -Min(stUp, AbsValue(rStTrend[1]))
    else rStTrend[1]
, stPivot);

plot StTrend = if Sign(rStTrend) == Sign(rStTrend[1]) then absValue(rStTrend) else Double.NaN;
StTrend.DefineColor("Up", Color.CYAN);
StTrend.DefineColor("Dn", Color.MAGENTA);
StTrend.AssignValueColor(if rStTrend > 0 then StTrend.Color("Up") else StTrend.Color("Dn"));
StTrend.HideBubble();
StTrend.SetLineWeight(3);

########################################
## Chandelier_Stops

def csATR = MovingAverage(csATRType, TrueRange(high, close, low), csATRLength) * csATRMult;

def smax = Lowest(low, csPeriod)[csShift] + csATR[csShift];
def smin = Highest(high, csPeriod)[csShift] - csATR[csShift];

def rCSTrend = compoundValue(1, if close > smax[1] then 1 else if close < smin[1] then -1 else rCSTrend[1], 0);

def rUB = compoundValue(1, if rCSTrend > 0 then if smax > rUB[1] then smax else rUB[1] else if rCSTrend < 0 then if smax < rUB[1] then smax else rUB[1] else rUB[1], high);

def rLB = compoundValue(1, if rCSTrend < 0 then if smin < rLB[1] then smin else rLB[1] else if rCSTrend > 0 then if smin > rLB[1] then smin else rLB[1] else rLB[1], low);

plot UB = if !csHideOpposite or rCSTrend < 0 then rUB else Double.NaN;
UB.SetDefaultColor(Color.MAGENTA);
UB.SetLineWeight(3);
UB.SetStyle(Curve.SHORT_DASH);
UB.HideBubble();

plot LB = if !csHideOpposite or rCSTrend > 0 then rLB else Double.NaN;
LB.SetDefaultColor(Color.CYAN);
LB.SetLineWeight(3);
LB.SetStyle(Curve.SHORT_DASH);
LB.HideBubble();

########################################
## SuperTrend of RSI

def avgDif = WildersAverage(AbsValue(rsiPrice - rsiPrice[1]), rsiLength);
def RSI = MovingAverage(rsiSmoothType, 50 * ((if avgDif != 0 then WildersAverage(rsiPrice - rsiPrice[1], rsiLength) / avgDif else 0) + 1), rsiSmooth);

def rsiATR = MovingAverage(rsiATRType, TrueRange(Highest(RSI, ceil(rsiATRMult)), RSI, Lowest(RSI, ceil(rsiATRMult))), rsiATRLength) * rsiATRMult;
def rsiUp = RSI + rsiATR;
def rsiDn = RSI - rsiATR;

def rRSITrend = compoundValue(1,
    if rRSITrend[1] > 0 then
        if RSI < Max(rsiDn[1], rRSITrend[1]) then -rsiUp
        else Max(rsiDn, rRSITrend[1])
    else if rRSITrend[1] < 0 then
        if RSI > Min(rsiUp[1], AbsValue(rRSITrend[1])) then rsiDn
        else -Min(rsiUp, AbsValue(rRSITrend[1]))
    else rRSITrend[1]
, RSI);

########################################
## SuperTrend of Ultimate Oscillator

def TR = TrueRange(high, close, low);
def BP = close - Min(close[1], low);
def nFast = (uoSlowLen / uoFastLen);
def nMed = (uoSlowLen / uoMedLen);
def trFast = sum(TR, uoFastLen);
def trMed = sum(TR, uoMedLen);
def trSlow = sum(TR, uoSlowLen);

def UO = 100 * (((if trFast != 0 then (sum(BP, uoFastLen) / trFast) * nFast else 0)
    +  (if trMed != 0 then (sum(BP, uoMedLen) / trMed) * nMed else 0)
    + (if trSlow != 0 then (sum(BP, uoSlowLen) / sum(TR, uoSlowLen)) else 0))
/ (nFast + nMed + 1));

def uoATR = MovingAverage(uoATRType, TrueRange(Highest(UO, ceil(uoATRMult)), UO, Lowest(UO, ceil(uoATRMult))), uoATRLength) * uoATRMult;
def uoUp = UO + uoATR;
def uoDn = UO - uoATR;

def rUOTrend = compoundValue(1,
    if rUOTrend[1] > 0 then
        if UO < Max(uoDn[1], rUOTrend[1]) then -uoUp
        else Max(uoDn, rUOTrend[1])
    else if rUOTrend[1] < 0 then
        if UO > Min(uoUp[1], AbsValue(rUOTrend[1])) then uoDn
        else -Min(uoUp, AbsValue(rUOTrend[1]))
    else rUOTrend[1]
, UO);

########################################
## Signals

def orderDir;
def p;
def sumUp = (rStTrend > 0) + (rCSTrend > 0) + (rRSITrend > 0) + (rUOTrend > 0);
def sumDn = (rStTrend < 0) + (rCSTrend < 0) + (rRSITrend < 0) + (rUOTrend < 0);

switch (signals) {
case OFF:
    orderDir = 0;
    p = 0;
case ALL:
    orderDir = compoundValue(1, if sumUp >= strength+1 then 1 else if sumDn >= strength+1 then -1 else orderDir[1], 0);
    p = if showPrompt then 1 else 0;
case ST:
    orderDir = rStTrend;
    p = if showPrompt then 2 else 0;
case CS:
    orderDir = rCSTrend;
    p = if showPrompt then 3 else 0;
case RSI:
    orderDir = rRSITrend;
    p = if showPrompt then 4 else 0;
case UO:
    orderDir = rUOTrend;
    p = if showPrompt then 5 else 0;
}

def isOrder = orderDir crosses 0;

def orderCount = compoundValue(1, if isNaN(isOrder) then 0 else if isOrder then orderCount[1] + 1 else orderCount[1], 0);

def noBar = isNaN(open[-1]);

def orderPrice = if isOrder then if noBar then close else open[-1] else orderPrice[1];
def profitLoss = if !isOrder or orderCount == 1 then 0 else if orderDir > 0 then orderPrice[1] - orderPrice else if orderDir < 0 then orderPrice - orderPrice[1] else 0;
def profitLossSum = compoundValue(1, if isNaN(isOrder) then 0 else if isOrder then profitLossSum[1] + profitLoss else profitLossSum[1], 0);

AddLabel(signals and showLabel, (if p==1 then "ALL: " else if p==2 then "ST: " else if p==3 then "CS: " else if p==4 then "RSI: " else if p==5 then "UO: " else "") + orderCount + " orders | P/L " + AsDollars((profitLossSum / tickSize()) * tickValue()), if profitLossSum > 0 then Color.GREEN else if profitLossSum < 0 then Color.RED else Color.GRAY);

AddChartBubble(signals and showBubbles and isOrder and orderDir > 0, low, profitLoss, if noBar then Color.LIGHT_GRAY else Color.GREEN, 0);
AddChartBubble(signals and showBubbles and isOrder and orderDir < 0, high, profitLoss, if noBar then Color.GRAY else Color.RED, 1);

AssignPriceColor(if !paintBars then Color.CURRENT
else if paintBars == paintBars.DIR then
    if orderDir > 0 then
        if rSTTrend < 0 or rCSTrend < 0 then Color.DARK_ORANGE
        else Color.UPTICK
    else if orderDir < 0 then
        if rSTTrend > 0 or rCSTrend > 0 then Color.YELLOW
        else Color.DOWNTICK
    else Color.GRAY
else if sumUp >= strength+1 then Color.UPTICK
else if sumDn >= strength+1 then Color.DOWNTICK
else if sumUp > sumDn then Color.YELLOW
else if sumDn > sumUp then Color.DARK_ORANGE
else Color.GRAY);

## END STUDY

mNnhh2X.png


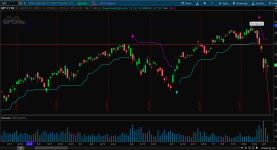
Supertrend - #hint: Alternative SuperTrend algorithm.

UNk7a5L.png


When you go into the properties, you'll notice how you can change the movingavg type from Simple, Exponential, Wilders, Hull, and Weighted. I'm still trying to figure out which would be best for these.

Contrary to what many think, I actually like using ATR trailing stop-esque indicators for both entry and management of a trade. These both might even work well together if you use one as an entry and the other to manage. I'm thinking this might work very well with AMM (Advanced Market Moves) indicator. Maybe use that as entry, and these as management. We should mix and match to see what is most effective.

Would appreciate your feedback after testing.
 

Attachments

  • mNnhh2X.png
    mNnhh2X.png
    193.4 KB · Views: 537
  • UNk7a5L.png
    UNk7a5L.png
    196.5 KB · Views: 614
Last edited by a moderator:

Join useThinkScript to post your question to a community of 21,000+ developers and traders.

Try Wilders, Weighted and Exponential. Trial and Error. Anything that Linus codes up is going to be written correctly. He's a pro. I like his stuff but sadly, not the way I trade. :( PS, follow him at MyTrade.com

We need to remind people that the thinkscript cloud by JQ is in the Tutorials section as the Universe of Thinkscript. That way people can search Universe in the box at the top...
 
Hi Everyone,
Great indicators, Thanks!
Anyone have any links with information/tutorials on the super combo indicator?
 
I've been using this indicator live for some time now. I use price action, volume, and VWAP in conjunction with it. I'll just say this: If you use this indicator and trade with the trend, it is a very powerful tool for scalping on the 1m chart. I find it more accurate than other "super-trend" indicators because you get multiple colors based on momentum (green/red for strong trends, yellow orange for moderate/weak ones), and it doesn't repaint. It is genuinely accurate, and the most likely time you'll see false signals is when they are against the prevailing trend. However, I regularly remove the bubbles intraday once entering a position because they can be intrusive and cover active candles.
 
@Dom173 The original Supertrend posted here does not repaint. However, this "combo" version include other components so I'm not sure.
 
@Germanjosh What I think you are asking:
If the supertrend (rStTrend ) is greater than zero (cyan dots) AND close is crossing above the supertrend?

I don't do alerts myself but try adding this line to the bottom of your study:
Ruby:
Alert(rStTrend > 0 and close crosses above rStTrend , "Cyan Dots Crossed", Alert.Bar, Sound.Bell);
I added the above change under the bottom of the script, and hit apply.

when I go to edit the script, there is an alert tab at the bottom with the above condition.

however, it didn’t sound off when the green candle stick closed above the dotted line

I think I missed up though. Referencing the first picture on the first page. There is an orange candle stick that is crossing above the purple dotted line.

I would like to create an alert that signals that crossing

https://ibb.co/cTMggsB
 
Last edited:
@Germanjosh
Updated code below. However, I would not recommend any strategy that is attempting to go long on a downtrend.
Ruby:
Alert(rStTrend < 0 and close crosses above rStTrend , "Magenta Dots Crossed", Alert.Bar, Sound.Bell);
 
Here is a watchlist column that will match the color of the last bar in case anyone wants to use it.
(that is, the color that is applied using the studies "directional" color assignment"

# START STUDY
## SuperCombo Bull/Bear Indicator
## linus, 2014-07-24, v0.1

#hint: SuperTrend of price, RSI and Ultimate Oscillator, combined with Chandelier stops.

## Signal inputs:
input paintBars = {OFF, default DIR, STR};
input signals = {OFF, default ALL, ST, CS, RSI, UO};
input strength = {"1", "2", default "3", "4"};
input showLabel = Yes;
input showBubbles = Yes;
input showPrompt = Yes;

## SuperTrend of Price inputs:
input stATRMult = 3.5;
input stATRLength = 22;
input stATRType = AverageType.WILDERS;
input stPivot = hl2;

## Chandelier Stop inputs:
input csPeriod = 15;
input csATRLength = 5;
input csATRMult = 3.0;
input csATRType = AverageType.SIMPLE;
input csShift = 1;
input csHideOpposite = Yes;

## SuperTrend of RSI inputs:
input rsiLength = 14;
input rsiPrice = close;
input rsiSmooth = 2;
input rsiSmoothType = AverageType.SIMPLE;
input rsiATRMult = 2.3;
input rsiATRLength = 25;
input rsiATRType = AverageType.WILDERS;

## SuperTrend of Ultimate Oscillator inputs:
input uoFastLen = 7;
input uoMedLen = 14;
input uoSlowLen = 28;
input uoATRMult = 2.8;
input uoATRLength = 3;
input uoATRType = AverageType.SIMPLE;

########################################
## SuperTrend of Price

def stATR = MovingAverage(stATRType, TrueRange(high, close, low), stATRLength) * stATRMult;

def stUp = stPivot + stATR;
def stDn = stPivot - stATR;

def rStTrend = compoundValue(1,
if rStTrend[1] > 0 then
if close < Max(stDn[1], rStTrend[1]) then -stUp
else Max(stDn, rStTrend[1])
else if rStTrend[1] < 0 then
if close > Min(stUp[1], AbsValue(rStTrend[1])) then stDn
else -Min(stUp, AbsValue(rStTrend[1]))
else rStTrend[1]
, stPivot);

plot StTrend = if Sign(rStTrend) == Sign(rStTrend[1]) then absValue(rStTrend) else Double.NaN;
StTrend.DefineColor("Up", Color.CYAN);
StTrend.DefineColor("Dn", Color.MAGENTA);
StTrend.AssignValueColor(if rStTrend > 0 then StTrend.Color("Up") else StTrend.Color("Dn"));
StTrend.HideBubble();
StTrend.SetLineWeight(3);

########################################
## Chandelier_Stops

def csATR = MovingAverage(csATRType, TrueRange(high, close, low), csATRLength) * csATRMult;

def smax = Lowest(low, csPeriod)[csShift] + csATR[csShift];
def smin = Highest(high, csPeriod)[csShift] - csATR[csShift];

def rCSTrend = compoundValue(1, if close > smax[1] then 1 else if close < smin[1] then -1 else rCSTrend[1], 0);

def rUB = compoundValue(1, if rCSTrend > 0 then if smax > rUB[1] then smax else rUB[1] else if rCSTrend < 0 then if smax < rUB[1] then smax else rUB[1] else rUB[1], high);

def rLB = compoundValue(1, if rCSTrend < 0 then if smin < rLB[1] then smin else rLB[1] else if rCSTrend > 0 then if smin > rLB[1] then smin else rLB[1] else rLB[1], low);

def UB = if !csHideOpposite or rCSTrend < 0 then rUB else Double.NaN;

def LB = if !csHideOpposite or rCSTrend > 0 then rLB else Double.NaN;

########################################
## SuperTrend of RSI

def avgDif = WildersAverage(AbsValue(rsiPrice - rsiPrice[1]), rsiLength);
def RSI = MovingAverage(rsiSmoothType, 50 * ((if avgDif != 0 then WildersAverage(rsiPrice - rsiPrice[1], rsiLength) / avgDif else 0) + 1), rsiSmooth);

def rsiATR = MovingAverage(rsiATRType, TrueRange(Highest(RSI, ceil(rsiATRMult)), RSI, Lowest(RSI, ceil(rsiATRMult))), rsiATRLength) * rsiATRMult;
def rsiUp = RSI + rsiATR;
def rsiDn = RSI - rsiATR;

def rRSITrend = compoundValue(1,
if rRSITrend[1] > 0 then
if RSI < Max(rsiDn[1], rRSITrend[1]) then -rsiUp
else Max(rsiDn, rRSITrend[1])
else if rRSITrend[1] < 0 then
if RSI > Min(rsiUp[1], AbsValue(rRSITrend[1])) then rsiDn
else -Min(rsiUp, AbsValue(rRSITrend[1]))
else rRSITrend[1]
, RSI);

########################################
## SuperTrend of Ultimate Oscillator

def TR = TrueRange(high, close, low);
def BP = close - Min(close[1], low);
def nFast = (uoSlowLen / uoFastLen);
def nMed = (uoSlowLen / uoMedLen);
def trFast = sum(TR, uoFastLen);
def trMed = sum(TR, uoMedLen);
def trSlow = sum(TR, uoSlowLen);

def UO = 100 * (((if trFast != 0 then (sum(BP, uoFastLen) / trFast) * nFast else 0)
+ (if trMed != 0 then (sum(BP, uoMedLen) / trMed) * nMed else 0)
+ (if trSlow != 0 then (sum(BP, uoSlowLen) / sum(TR, uoSlowLen)) else 0))
/ (nFast + nMed + 1));

def uoATR = MovingAverage(uoATRType, TrueRange(Highest(UO, ceil(uoATRMult)), UO, Lowest(UO, ceil(uoATRMult))), uoATRLength) * uoATRMult;
def uoUp = UO + uoATR;
def uoDn = UO - uoATR;

def rUOTrend = compoundValue(1,
if rUOTrend[1] > 0 then
if UO < Max(uoDn[1], rUOTrend[1]) then -uoUp
else Max(uoDn, rUOTrend[1])
else if rUOTrend[1] < 0 then
if UO > Min(uoUp[1], AbsValue(rUOTrend[1])) then uoDn
else -Min(uoUp, AbsValue(rUOTrend[1]))
else rUOTrend[1]
, UO);

########################################

## Signals

def orderDir;
def sumUp = (rStTrend > 0) + (rCSTrend > 0) + (rRSITrend > 0) + (rUOTrend > 0);
def sumDn = (rStTrend < 0) + (rCSTrend < 0) + (rRSITrend < 0) + (rUOTrend < 0);

switch (signals) {
case OFF:
orderDir = 0;
case ALL:
orderDir = compoundValue(1, if sumUp >= strength+1 then 1 else if sumDn >= strength+1 then -1 else orderDir[1], 0);
case ST:
orderDir = rStTrend;
case CS:
orderDir = rCSTrend;
case RSI:
orderDir = rRSITrend;
case UO:
orderDir = rUOTrend;
}

AssignBackgroundColor(if !paintBars then Color.CURRENT
else if paintBars == paintBars.DIR then
if orderDir > 0 then
if rSTTrend < 0 or rCSTrend < 0 then Color.DARK_ORANGE
else Color.UPTICK
else if orderDir < 0 then
if rSTTrend > 0 or rCSTrend > 0 then Color.YELLOW
else Color.DOWNTICK
else Color.GRAY
else if sumUp >= strength+1 then Color.UPTICK
else if sumDn >= strength+1 then Color.DOWNTICK
else if sumUp > sumDn then Color.YELLOW
else if sumDn > sumUp then Color.DARK_ORANGE
else Color.GRAY);


## END STUDY
 
where are the entry and exit signals.

I am assuming

Beginning of blue line -- buy (call)
End of blue line -- sell (call)

beginning of Purple line -- buy (put)
End of Purple line -- sell (put)?
 
This looked good until I tried it on an actual trade. During the practice trades entering when the purple line disappeared and the blue line (or vice versa) appeared worked quite well. When I did it on a live trade it moved a little up, then down, then a little sideways, then up, then took a huge nosedive. It would be great if we could post videos on here or have graphics we could post showing how to use different studies that are created here. I better go close out this trade before it dumps anymore! A lot of these studies look great with all the graphic details, but without detailed explanations on how it works you are left to figure it out on your own or read through a lot of comments. I think I have discovered the issue with why it didn't perform as anticipated with the live trade. The cloud I use was red during the entire trade, but during all the practice trades it was green. Everything else was the same, but I hadn't taken that into consideration. If I knew how to post videos on here I would try to make them.

Update: now that I have a better understanding and combined it with another indicator it is looking a lot better and appears to eliminate a lot of false signals. I'm going to practice with it for another 2 months or so and see how this filtering works.
 
Last edited:
This indicator is useful for defining trend.
No, indicator can be used in isolation for finding buy or sell signals.
Chart Analysis requires the minimum of three indicators:
https://usethinkscript.com/threads/basics-for-developing-a-good-strategy.8058/

When including this indicator into your strategy, you would look for your other indicators to confirm entry when momentum resumes on the yellow candles or find the reversal occurring in the red bearish candles.

When used as part of a good basic strategy, supertrends will perform slightly better than moving average strategies overall.

Find out more about Supertrends:
https://usethinkscript.com/threads/supertrend-indicator-by-mobius-for-thinkorswim.7/#post-77876
 
Last edited:

Similar threads

Not the exact question you're looking for?

Start a new thread and receive assistance from our community.

87k+ Posts
376 Online
Create Post

Similar threads

Similar threads

The Market Trading Game Changer

Join 2,500+ subscribers inside the useThinkScript VIP Membership Club
  • Exclusive indicators
  • Proven strategies & setups
  • Private Discord community
  • ‘Buy The Dip’ signal alerts
  • Exclusive members-only content
  • Add-ons and resources
  • 1 full year of unlimited support

Frequently Asked Questions

What is useThinkScript?

useThinkScript is the #1 community of stock market investors using indicators and other tools to power their trading strategies. Traders of all skill levels use our forums to learn about scripting and indicators, help each other, and discover new ways to gain an edge in the markets.

How do I get started?

We get it. Our forum can be intimidating, if not overwhelming. With thousands of topics, tens of thousands of posts, our community has created an incredibly deep knowledge base for stock traders. No one can ever exhaust every resource provided on our site.

If you are new, or just looking for guidance, here are some helpful links to get you started.

What are the benefits of VIP Membership?
VIP members get exclusive access to these proven and tested premium indicators: Buy the Dip, Advanced Market Moves 2.0, Take Profit, and Volatility Trading Range. In addition, VIP members get access to over 50 VIP-only custom indicators, add-ons, and strategies, private VIP-only forums, private Discord channel to discuss trades and strategies in real-time, customer support, trade alerts, and much more. Learn all about VIP membership here.
How can I access the premium indicators?
To access the premium indicators, which are plug and play ready, sign up for VIP membership here.
Back
Top