You should upgrade or use an alternative browser.
Heiken-Ashi Moving Average (HAMA) for ThinkorSwim
- Thread starter MBF
- Start date
Join useThinkScript to post your question to a community of 21,000+ developers and traders.
Feel free to edit the length of the moving average to suit your requirements:
# START
def length = 8;
def HAopen;
def HAhigh;
def HAlow;
def HAclose;
HAopen = CompoundValue(1, (haopen[1] + haclose[1]) / 2, (open[1] + close) / 2);
HAhigh = Max(high, close[1]);
HAlow = Min(low, close[1]);
HAclose = (HAopen + HAclose[1] + HAlow + close) / 4;
AssignPriceColor(if HAclose > HAopen then Color.GREEN else color.RED);
plot HAMA = Average(HAclose, length);
# END#HK
#Use bar to figure trendDown or confirm.
#heikin ashi bars. close=OHLC/4. open=1/2(open[1]+close[1]) and HA trend
#
def haclose = (open + high + low + close) / 4;
def haopen = CompoundValue(1, (haopen[1] + haclose[1]) / 2, (open[1] + close[1]) / 2);
def hahigh=max(open,max(close,high));def halow=min(open,min(close,high));
def HAtrendUP = haclose > haclose[1];
def upBar = if HAtrendUP then upBar[1] + 1 else 0;
def HATrendDown = haclose <= haclose[1];
def downBar = if HATrendDown then downBar[1] + 1 else 0;
def bars = upBar + downBar;
#the one with body small relative to wicks . let say less than 0.3
def HAtransition=absvalue((haopen-haclose)/(hahigh-halow))<0.3;
def HARed = HAOpen > HAclose;
def HAGreen = !HARed;
def HADecidedRed = HARed and HAHigh == HAopen;
def HADecidedGreen = HAGreen and HAlow == HAOpen;
plot data=0;
#
AssignPriceColor( if hatransition then color.MAGENTA
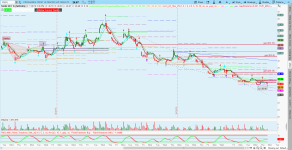
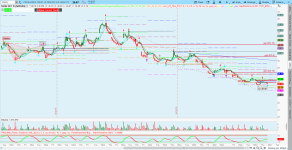
else Color.CURRENT);Take a look at this beauty.
p.s. I am now of opinion that inidcator based on the single timeframe can never do that. In fact probably no indicator can do that with high probability if its single timeframe, price action based only. There are other factors which determine that.
I been doing stocks in play for a while now - its far from easy! (at least for me)
Here is this very simple scan: https://tos.mx/WXUxaCb
Another proxy for stocks in play I use is sizzle index. (>2 is wide critera, >5 picks something with big catalyst practically every day)
There is small bug here (uses close instead of haclose). Anyhow this HA code works better than one I was using before. Integrated it with my transition code https://tos.mx/aA77lzO
def length = 8;
def HAopen;
def HAhigh;
def HAlow;
def HAclose;
HAopen = CompoundValue(1, (haopen[1] + haclose[1]) / 2, (open[1] + close) / 2);
HAhigh = Max(high, close[1]);
HAlow = Min(low, close[1]);
HAclose = (HAopen + HAclose[1] + HAlow + close) / 4;
AssignPriceColor(if HAclose > HAopen then Color.GREEN else color.RED);
plot HAMA = Average(HAclose, length);HighBredCloud
Well-known member
# Mobius
# SuperTrend HeikenAshi
# V03.10.2015
# Up = (HIGH + LOW) / 2 + Multiplier * ATR
# Down = (HIGH + LOW) / 2 – Multiplier * ATR
# When the change of trend occurs, the indicator flips

input AtrMult = .70;
input nATR = 4;
input AvgType = AverageType.HULL;
input PaintBars = yes;
input BubbleOn = no;
input ShowLabel = no;
input AlertOn = no;
input PlotLine = no;

def HAopen;
def HAhigh;
def HAlow;
def HAclose;
HAopen = CompoundValue(1, (haopen[1] + haclose[1]) / 2, (open[1] + close) / 2);
HAhigh = Max(high, close[1]);
HAlow = Min(low, close[1]);
haclose = (HAopen + HAclose[1] + HAlow + close) / 4;
def v = volume;
def bar = barNumber();
def EOD = if SecondsTillTime(1545) == 0 and
             SecondsFromTime(1545) == 0
          then 1
          else 0;
def NotActive = if SecondsFromTime(1545) > 0
                then 1
                else 0;
def ATR = MovingAverage(AvgType, TrueRange(HAhigh, HAclose, HAlow), nATR);
def UP = HL2 + (AtrMult * ATR);
def DN = HL2 + (-AtrMult * ATR);
def ST = if close < ST[1]
         then Round(UP / tickSize(), 0) * tickSize()
         else Round(DN / tickSize(), 0) * tickSize();
plot SuperTrend = ST;
SuperTrend.SetHiding(!PlotLine);
SuperTrend.AssignValueColor(if close < ST then Color.RED else Color.GREEN);
SuperTrend.SetPaintingStrategy(PaintingStrategy.Line);
AssignPriceColor(if PaintBars and close < ST
                 then Color.RED
                 else if PaintBars and close > ST
                      then Color.GREEN
                      else Color.CURRENT);
plot ST_point = if isNaN(close[-1])
                then ST
                else double.nan;
ST_point.SetStyle(Curve.Points);
ST_point.SetLineWeight(3);
ST_point.SetDefaultColor(Color.Yellow);
# End Code SuperTrend HeikenAshisicilianslice
New member
Here is the indicator. Hope someone can help. Thanks in advance.
https://tos.mx/pLITkME
sicilianslice
New member
| Thread starter | Similar threads | Forum | Replies | Date |
|---|---|---|---|---|
|
|
RSI-Heiken Ashi For ThinkOrSwim | Indicators | 29 | |
|
|
MA Colored Heiken Ashi Trend with PaintBars for ThinkorSwim | Indicators | 17 | |
| P | Heikin-Ashi Candles Lower Chart For ThinkorSwim (assorted versions) | Indicators | 28 | |
| V | Heikin Ashi For ThinkOrSwim | Indicators | 23 | |
|
|
Smoothed Heikin-Ashi for ThinkorSwim | Indicators | 48 |
Similar threads
-
-
MA Colored Heiken Ashi Trend with PaintBars for ThinkorSwim
- Started by Welkin
- Replies: 17
-
Heikin-Ashi Candles Lower Chart For ThinkorSwim (assorted versions)
- Started by petergluis
- Replies: 28
-
-
Not the exact question you're looking for?
Start a new thread and receive assistance from our community.
Similar threads
-
-
MA Colored Heiken Ashi Trend with PaintBars for ThinkorSwim
- Started by Welkin
- Replies: 17
-
Heikin-Ashi Candles Lower Chart For ThinkorSwim (assorted versions)
- Started by petergluis
- Replies: 28
-
-
Similar threads
-
-
MA Colored Heiken Ashi Trend with PaintBars for ThinkorSwim
- Started by Welkin
- Replies: 17
-
Heikin-Ashi Candles Lower Chart For ThinkorSwim (assorted versions)
- Started by petergluis
- Replies: 28
-
-
The Market Trading Game Changer
- Exclusive indicators
- Proven strategies & setups
- Private Discord community
- ‘Buy The Dip’ signal alerts
- Exclusive members-only content
- Add-ons and resources
- 1 full year of unlimited support
Frequently Asked Questions
useThinkScript is the #1 community of stock market investors using indicators and other tools to power their trading strategies. Traders of all skill levels use our forums to learn about scripting and indicators, help each other, and discover new ways to gain an edge in the markets.
We get it. Our forum can be intimidating, if not overwhelming. With thousands of topics, tens of thousands of posts, our community has created an incredibly deep knowledge base for stock traders. No one can ever exhaust every resource provided on our site.
If you are new, or just looking for guidance, here are some helpful links to get you started.
- The most viewed thread:
https://usethinkscript.com/threads/repainting-trend-reversal-for-thinkorswim.183/ - Our most popular indicator:
https://usethinkscript.com/threads/buy-the-dip-indicator-for-thinkorswim.3553/ - Answers to frequently asked questions:
https://usethinkscript.com/threads/answers-to-commonly-asked-questions.6006/


