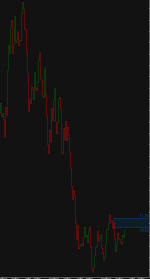
Stair step on close moving average (line chart)

seed money

New member
Anyone have or could code a moving average that changes color based on the closes that would show up as a stair step instead of just a line on close?

I like to gray out my candles and put a 1 period moving average on the chart. It’s helps me focus on the closes while still being able to see the full candle without too much distraction to my eyes. Thank you
 
Solution
Stair step moving average / Line on close

Does anyone know how to create a stair-step moving average? It would look like the line on close chart, but a stair step instead. Thank you

Perhaps this that I did awhile ago might help.

The upper chart shows the stair step with candles.
The candles can be hidden as shown in the lower chart by 1.) unchecking show price subgraph in chart settings/general 2.) moving the study to the lower panel

Screenshot 2023-05-30 072850.png
Code:
#StepMA_PriceChannel - BLT 20170013
#Step_MovingAverage - adapted from prorealcode
script stepscript {
    input steptype    = { default ATR, Fixed};
    input fixed_step  = .05;

    input stepma_finetuner = 0.5;#hint stepma_finetuner: 0.0 - 1.00; lower the value then closer...
Stair step moving average / Line on close

Does anyone know how to create a stair-step moving average? It would look like the line on close chart, but a stair step instead. Thank you
 

Attachments

  • stair step.png
    stair step.png
    5.9 KB · Views: 101
I believe what you're looking at is a Kagi chart, which is not an indicator, but a totally different chart type. TOS does not have the ability to display a Kagi chart or what you're asking for as an indicator.

The painting strategy (line type) in @Joshua's picture is about as good as it gets if you're looking for a "stairstep" style drawing. In fact, I don't know that any system, without creating a custom bar type, can display this since the price is centered on the bar's center. What you're asking for is essentially a custom bar type and an indicator wrapped into one.

This may be hard to understand without a much deeper explanation of how bars are drawn in TOS and other systems. If you need more of an explanation I can probably provide one. But, in the meantime, you could look up the PaintingStrategy page on TOS's site (link HERE) and try to understand what I mean.
 
Stair step moving average / Line on close

Does anyone know how to create a stair-step moving average? It would look like the line on close chart, but a stair step instead. Thank you

Perhaps this that I did awhile ago might help.

The upper chart shows the stair step with candles.
The candles can be hidden as shown in the lower chart by 1.) unchecking show price subgraph in chart settings/general 2.) moving the study to the lower panel

Screenshot 2023-05-30 072850.png
Code:
#StepMA_PriceChannel - BLT 20170013
#Step_MovingAverage - adapted from prorealcode
script stepscript {
    input steptype    = { default ATR, Fixed};
    input fixed_step  = .05;

    input stepma_finetuner = 0.5;#hint stepma_finetuner: 0.0 - 1.00; lower the value then closer stepma is to price

    input stepaveragetype = AverageType.SIMPLE;
    input stepavg_length  = 8;
    input stepprice       = close;

    input stepatraveragetype = AverageType.WILDERS;
    input stepatrlength      = 14;
    input stepatrfactor      = 1.0;

    def step;
    switch (steptype){
    case Fixed:
        step = fixed_step;
    case ATR:
        step = ATR(stepatrlength, stepatraveragetype) * stepatrfactor;
}

    def MA   = MovingAverage(stepaveragetype, stepprice, stepavg_length)[1];
    def ssMA = if (MA > ssMA[1] + step * stepma_finetuner)
           then MA
           else if (MA < ssMA[1] - step * stepma_finetuner)
           then MA
           else ssMA[1];
    plot stepma = ssMA;
}
input steptype_    = {ATR, default Fixed};
input fixed_step_  = .1;

input stepma_finetuner_ = 0.3;#hint stepma_finetuner_: 0.0 - 1.00; lower then value then closer stepma is to price
Assert(Between(stepma_finetuner_, 0.0, 1.00), "fine tuner must be between 0.0 - 1.00");

input stepaveragetype_ = AverageType.EXPONENTIAL;
input stepavg_length_  = 5;
input stepprice_       = ohlc4;

input stepmaatraveragetype_ = AverageType.WILDERS;
input stepmaatrlength_      = 7;
input stepatrfactor_        = 1.0;

plot stepma_ = stepscript(steptype_, fixed_step_, stepma_finetuner_, stepaveragetype_, stepavg_length_ , stepprice_, stepmaatraveragetype_, stepmaatrlength_, stepatrfactor_);

stepma_.DefineColor("UP", Color.YELLOW);
stepma_.DefineColor("DOWN", Color.BLACK);

def up;
up = if up[1] == 0 and stepma_ > stepma_[1] then 1  #used without HA Smoothed as price
         else if up[1] == 1 and stepma_ >= stepma_[1] then 1
         else 0;
stepma_.AssignValueColor(if up then stepma_.Color("UP") else stepma_.Color("DOWN"));
stepma_.HideBubble();
stepma_.SetLineWeight(3);

def stephigh = stepscript(steptype_, fixed_step_, stepma_finetuner_, stepaveragetype_, stepavg_length_ , high, stepmaatraveragetype_, stepmaatrlength_);
def steplow = stepscript(steptype_, fixed_step_, stepma_finetuner_, stepaveragetype_, stepavg_length_ , low, stepmaatraveragetype_, stepmaatrlength_);
 
Solution

Join useThinkScript to post your question to a community of 21,000+ developers and traders.

Similar threads

Not the exact question you're looking for?

Start a new thread and receive assistance from our community.

87k+ Posts
396 Online
Create Post

Similar threads

Similar threads

The Market Trading Game Changer

Join 2,500+ subscribers inside the useThinkScript VIP Membership Club
  • Exclusive indicators
  • Proven strategies & setups
  • Private Discord community
  • ‘Buy The Dip’ signal alerts
  • Exclusive members-only content
  • Add-ons and resources
  • 1 full year of unlimited support

Frequently Asked Questions

What is useThinkScript?

useThinkScript is the #1 community of stock market investors using indicators and other tools to power their trading strategies. Traders of all skill levels use our forums to learn about scripting and indicators, help each other, and discover new ways to gain an edge in the markets.

How do I get started?

We get it. Our forum can be intimidating, if not overwhelming. With thousands of topics, tens of thousands of posts, our community has created an incredibly deep knowledge base for stock traders. No one can ever exhaust every resource provided on our site.

If you are new, or just looking for guidance, here are some helpful links to get you started.

What are the benefits of VIP Membership?
VIP members get exclusive access to these proven and tested premium indicators: Buy the Dip, Advanced Market Moves 2.0, Take Profit, and Volatility Trading Range. In addition, VIP members get access to over 50 VIP-only custom indicators, add-ons, and strategies, private VIP-only forums, private Discord channel to discuss trades and strategies in real-time, customer support, trade alerts, and much more. Learn all about VIP membership here.
How can I access the premium indicators?
To access the premium indicators, which are plug and play ready, sign up for VIP membership here.
Back
Top