
BullParagon
New member
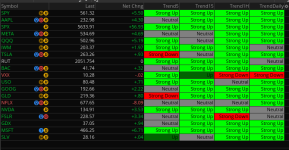
I added Trend Painter to Multiple Time Frames.
https://usethinkscript.com/threads/...or-with-buy-sell-signals-for-thinkorswim.226/
I am going to scan for Daily "GU is True" then watch the lower TF columns for entries and exits.
My next step will be to scan "GU is True" on 5M, when each of the other TFs are already Green.
I am struggling in the scan settings to define Daily TF is "Strong Buy", 1H is "Strong Buy" 15M is "Strong Buy" and 5M is giving the "GU is True".
I want to use this for scalps. I have the "Gu is true" the higher TFs being in "Strong Buy" mode,
I am struggling to build in to the scan. Any help is greatly appreciated.
Ruby:
declare upper;

input over_bought = 80;
input over_sold = 20;
input KPeriod = 10;
input DPeriod = 10;
input priceH = high;
input priceL = low;
input priceC = close;
input slowing_period = 3;
input smoothingType = {default SMA, EMA};

def lowest_k = Lowest(priceL, KPeriod);
def c1 = priceC - lowest_k;
def c2 = Highest(priceH, KPeriod) - lowest_k;
def FastK = if c2 != 0 then c1 / c2 * 100 else 0;

def FullK;
def FullD;

switch (smoothingType) {
case SMA:
    FullK = Average(FastK, slowing_period);
    FullD = Average(FullK, DPeriod);
case EMA:
    FullK = ExpAverage(FastK, slowing_period);
    FullD = ExpAverage(FullK, DPeriod);
}

def pricefilterup = if close > close[50] then 1 else 0;
def pricefilterdown = if close < close [50] then 1 else 0;

def OverBoughtAdd = if FullK < over_bought and FullK[1] >= over_bought then 1 else 0;
def OverSoldAdd = if FullK > over_sold and FullK[1] <= over_sold then 1 else 0;

def na = Double.NaN;

#Plot arrows
plot up = if StrongBuy and OverSoldAdd  and pricefilterup then low - (3 * TickSize()) else na;
plot down = if StrongSell and OverBoughtAdd and pricefilterdown then high + (3 * TickSize()) else na;
up.SetPaintingStrategy(PaintingStrategy.ARROW_UP);
down.SetPaintingStrategy(PaintingStrategy.ARROW_DOWN);
Attachments
Last edited by a moderator: